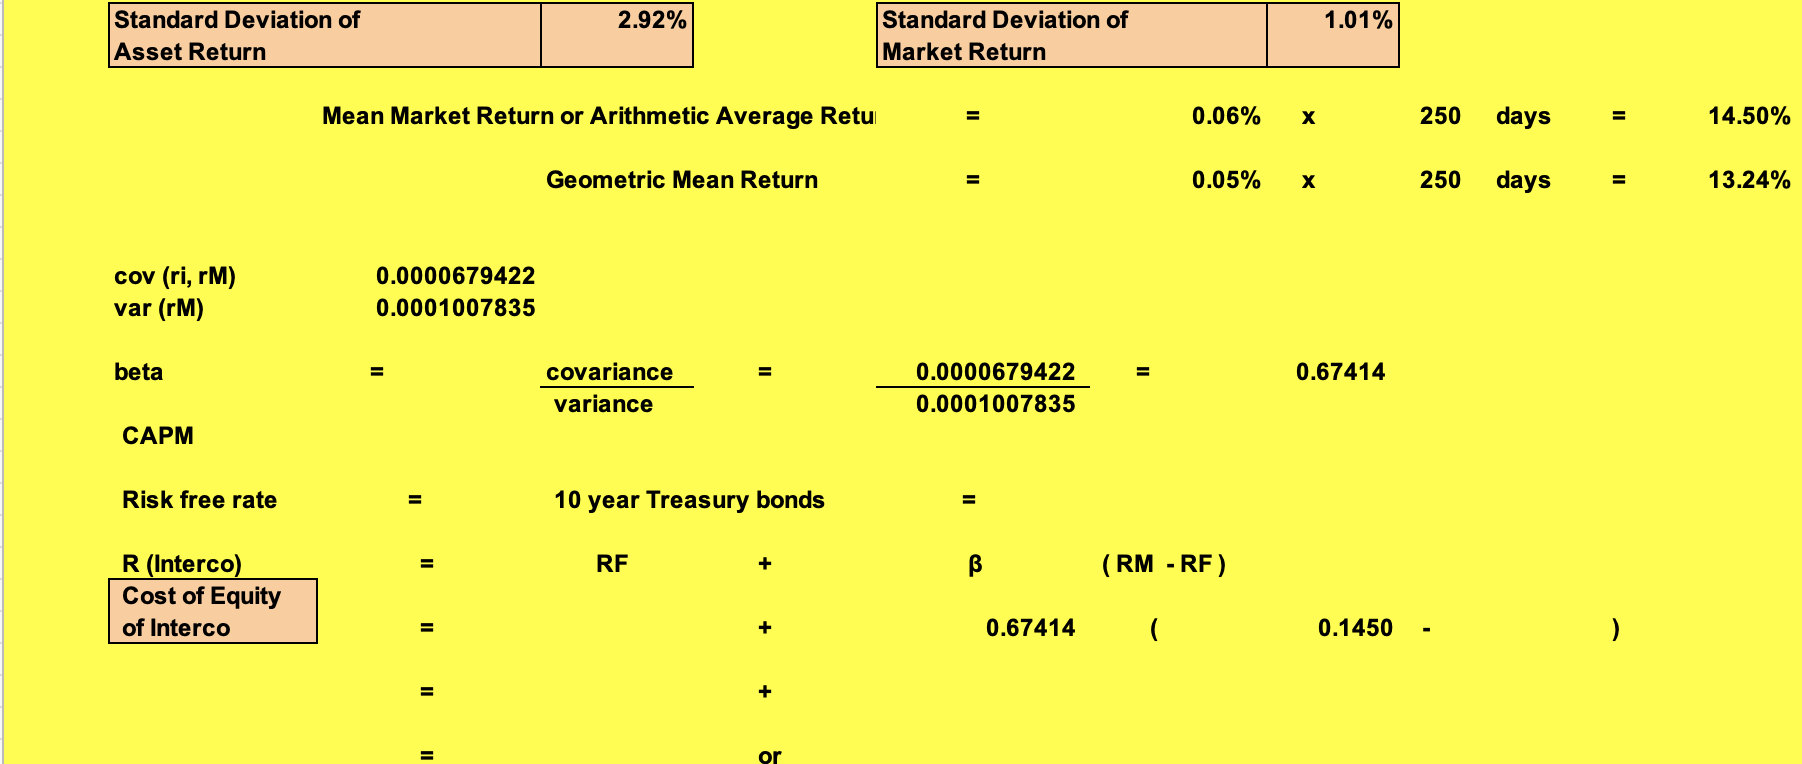
please help me fill in the blanks


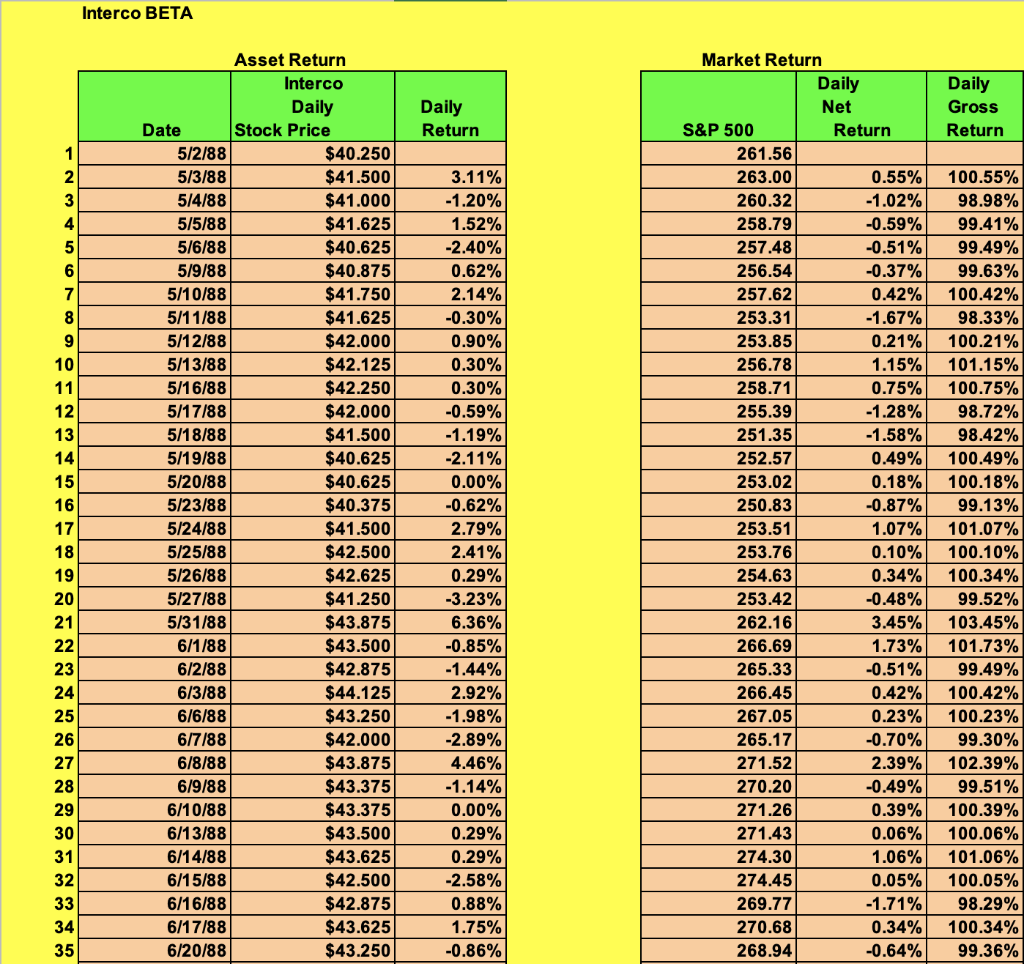
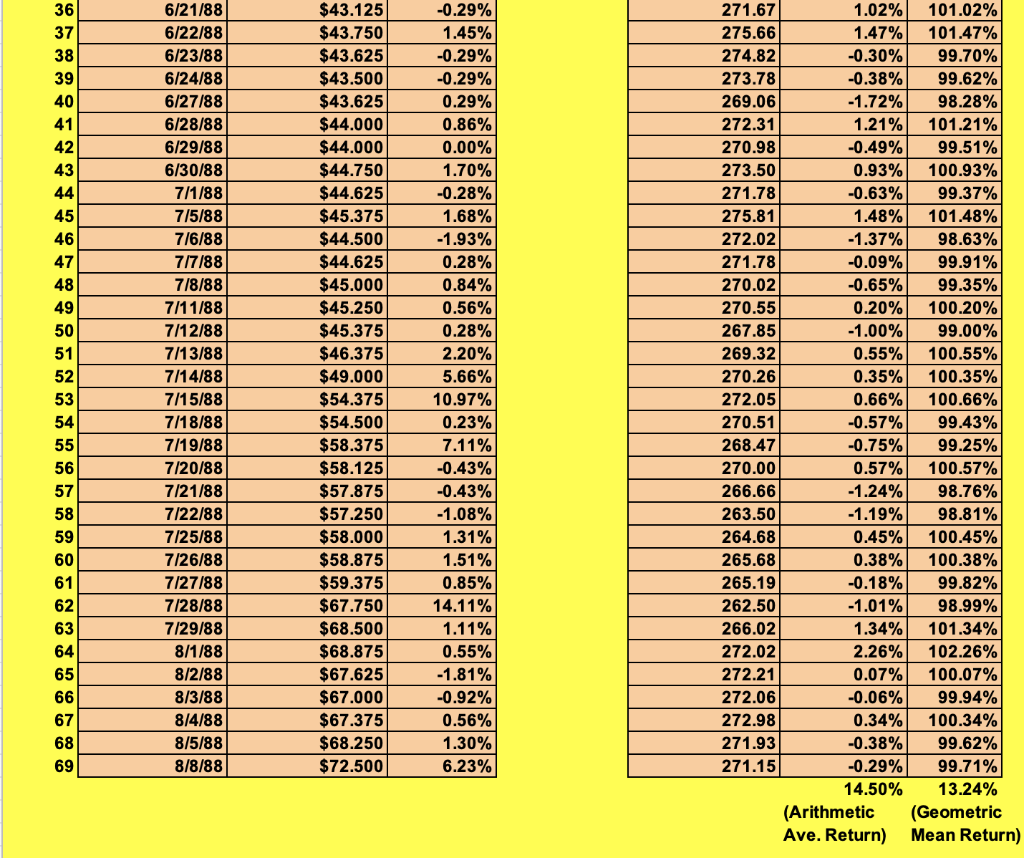
Interco BETA Daily Return Daily Gross Return 1 2 3 4 5 6 7 8 9 10 11 12 13 14 15 16 17 18 19 20 21 22 23 24 25 26 27 28 29 30 31 32 33 34 35 Asset Return Interco Daily Date Stock Price 5/2/88 $40.250 5/3/88 $41.500 5/4/88 $41.000 5/5/88 $41.625 5/6/88 $40.625 5/9/88 $40.875 5/10/88 $41.750 5/11/88 $41.625 5/12/88 $42.000 5/13/88 $42.125 5/16/88 $42.250 5/17/88 $42.000 5/18/88 $41.500 5/19/88 $40.625 5/20/88 $40.625 5/23/88 $40.375 5/24/88 $41.500 5/25/88 $42.500 5/26/88 $42.625 5/27/88 $41.250 5/31/88 $43.875 6/1/88 $43.500 6/2/88 $42.875 6/3/88 $44.125 6/6/88 $43.250 6/7/88 $42.000 6/8/88 $43.875 6/9/88 $43.375 6/10/88 $43.375 6/13/88 $43.500 6/14/88 $43.625 6/15/88 $42.500 6/16/88 $42.875 6/17/88 $43.625 6/20/88 $43.250 3.11% -1.20% 1.52% -2.40% 0.62% 2.14% -0.30% 0.90% 0.30% 0.30% -0.59% -1.19% -2.11% 0.00% -0.62% 2.79% 2.41% 0.29% -3.23% 6.36% -0.85% -1.44% 2.92% -1.98% -2.89% 4.46% -1.14% 0.00% 0.29% 0.29% -2.58% 0.88% 1.75% -0.86% Market Return Daily Net S&P 500 Return 261.56 263.00 0.55% 260.32 -1.02% 258.79 -0.59% 257.48 -0.51% 256.54 -0.37% 257.62 0.42% 253.31 -1.67% 253.85 0.21% 256.78 1.15% 258.71 0.75% 255.39 -1.28% 251.35 -1.58% 252.57 0.49% 253.02 0.18% 250.83 -0.87% 253.51 1.07% 253.76 0.10% 254.63 0.34% 253.42 -0.48% 262.16 3.45% 266.69 1.73% 265.33 -0.51% 266.45 0.42% 267.05 0.23% 265.17 -0.70% 271.52 2.39% 270.20 -0.49% 271.26 0.39% 271.43 0.06% 274.30 1.06% 274.45 0.05% 269.77 -1.71% 270.68 0.34% 268.94 -0.64% 100.55% 98.98% 99.41% 99.49% 99.63% 100.42% 98.33% 100.21% 101.15% 100.75% 98.72% 98.42% 100.49% 100.18% 99.13% 101.07% 100.10% 100.34% 99.52% 103.45% 101.73% 99.49% 100.42% 100.23% 99.30% 102.39% 99.51% 100.39% 100.06% 101.06% 100.05% 98.29% 100.34% 99.36% 36 37 38 39 40 41 42 43 44 45 46 47 48 49 50 51 52 53 54 55 56 6/21/88 6/22/88 6/23/88 6/24/88 6/27/88 6/28/88 6/29/88 6/30/88 7/1/88 7/5/88 7/6/88 7/7/88 7/8/88 7/11/88 7/12/88 7/13/88 7/14/88 7/15/88 7/18/88 7/19/88 7/20/88 7/21/88 7/22/88 7/25/88 7/26/88 7/27/88 7/28/88 7/29/88 8/1/88 8/2/88 8/3/88 8/4/88 8/5/88 8/8/88 $43.125 $43.750 $43.625 $43.500 $43.625 $44.000 $44.000 $44.750 $44.625 $45.375 $44.500 $44.625 $45.000 $45.250 $45.375 $46.375 $49.000 $54.375 $54.500 $58.375 $58.125 $57.875 $57.250 $58.000 $58.875 $59.375 $67.750 $68.500 $68.875 $67.625 $67.000 $67.375 $68.250 $72.500 -0.29% 1.45% -0.29% -0.29% 0.29% 0.86% 0.00% 1.70% -0.28% 1.68% -1.93% 0.28% 0.84% 0.56% 0.28% 2.20% 5.66% 10.97% 0.23% 7.11% -0.43% -0.43% -1.08% 1.31% 1.51% 0.85% 14.11% 1.11% 0.55% -1.81% -0.92% 0.56% 1.30% 6.23% 271.67 1.02% 101.02% 275.66 1.47% 101.47% 274.82 -0.30% 99.70% 273.78 -0.38% 99.62% 269.06 -1.72% 98.28% 272.31 1.21% 101.21% 270.98 -0.49% 99.51% 273.50 0.93% 100.93% 271.78 -0.63% 99.37% 275.81 1.48% 101.48% 272.02 -1.37% 98.63% 271.78 -0.09% 99.91% 270.02 -0.65% 99.35% 270.55 0.20% 100.20% 267.85 -1.00% 99.00% 269.32 0.55% 100.55% 270.26 0.35% 100.35% 272.05 0.66% 100.66% 270.51 -0.57% 99.43% 268.47 -0.75% 99.25% 270.00 0.57% 100.57% 266.66 98.76% 263.50 -1.19% 98.81% 264.68 0.45% 100.45% 265.68 0.38% 100.38% 265.19 -0.18% 99.82% 262.50 -1.01% 98.99% 266.02 1.34% 101.34% 272.02 2.26% 102.26% 272.21 0.07% 100.07% 272.06 -0.06% 99.94% 272.98 0.34% 100.34% 271.93 -0.38% 99.62% 271.15 -0.29% 99.71% 14.50% 13.24% (Arithmetic (Geometric Ave. Return) Mean Return) 57 -1.24% 58 59 60 61 62 63 64 65 66 67 68 69 2.92% 1.01% Standard Deviation of Asset Return Standard Deviation of Market Return Mean Market Return or Arithmetic Average Retui = 0.06% x 250 days = II 14.50% Geometric Mean Return = 0.05% 250 days = 13.24% cov (ri, rm) var (rm) 0.0000679422 0.0001007835 beta = = 0.67414 covariance variance 0.0000679422 0.0001007835 CAPM Risk free rate = 10 year Treasury bonds = = RF + B (RM -RF) R (Interco) Cost of Equity of Interco = + 0.67414 ( 0.1450 ). = + or Interco BETA Daily Return Daily Gross Return 1 2 3 4 5 6 7 8 9 10 11 12 13 14 15 16 17 18 19 20 21 22 23 24 25 26 27 28 29 30 31 32 33 34 35 Asset Return Interco Daily Date Stock Price 5/2/88 $40.250 5/3/88 $41.500 5/4/88 $41.000 5/5/88 $41.625 5/6/88 $40.625 5/9/88 $40.875 5/10/88 $41.750 5/11/88 $41.625 5/12/88 $42.000 5/13/88 $42.125 5/16/88 $42.250 5/17/88 $42.000 5/18/88 $41.500 5/19/88 $40.625 5/20/88 $40.625 5/23/88 $40.375 5/24/88 $41.500 5/25/88 $42.500 5/26/88 $42.625 5/27/88 $41.250 5/31/88 $43.875 6/1/88 $43.500 6/2/88 $42.875 6/3/88 $44.125 6/6/88 $43.250 6/7/88 $42.000 6/8/88 $43.875 6/9/88 $43.375 6/10/88 $43.375 6/13/88 $43.500 6/14/88 $43.625 6/15/88 $42.500 6/16/88 $42.875 6/17/88 $43.625 6/20/88 $43.250 3.11% -1.20% 1.52% -2.40% 0.62% 2.14% -0.30% 0.90% 0.30% 0.30% -0.59% -1.19% -2.11% 0.00% -0.62% 2.79% 2.41% 0.29% -3.23% 6.36% -0.85% -1.44% 2.92% -1.98% -2.89% 4.46% -1.14% 0.00% 0.29% 0.29% -2.58% 0.88% 1.75% -0.86% Market Return Daily Net S&P 500 Return 261.56 263.00 0.55% 260.32 -1.02% 258.79 -0.59% 257.48 -0.51% 256.54 -0.37% 257.62 0.42% 253.31 -1.67% 253.85 0.21% 256.78 1.15% 258.71 0.75% 255.39 -1.28% 251.35 -1.58% 252.57 0.49% 253.02 0.18% 250.83 -0.87% 253.51 1.07% 253.76 0.10% 254.63 0.34% 253.42 -0.48% 262.16 3.45% 266.69 1.73% 265.33 -0.51% 266.45 0.42% 267.05 0.23% 265.17 -0.70% 271.52 2.39% 270.20 -0.49% 271.26 0.39% 271.43 0.06% 274.30 1.06% 274.45 0.05% 269.77 -1.71% 270.68 0.34% 268.94 -0.64% 100.55% 98.98% 99.41% 99.49% 99.63% 100.42% 98.33% 100.21% 101.15% 100.75% 98.72% 98.42% 100.49% 100.18% 99.13% 101.07% 100.10% 100.34% 99.52% 103.45% 101.73% 99.49% 100.42% 100.23% 99.30% 102.39% 99.51% 100.39% 100.06% 101.06% 100.05% 98.29% 100.34% 99.36% 36 37 38 39 40 41 42 43 44 45 46 47 48 49 50 51 52 53 54 55 56 6/21/88 6/22/88 6/23/88 6/24/88 6/27/88 6/28/88 6/29/88 6/30/88 7/1/88 7/5/88 7/6/88 7/7/88 7/8/88 7/11/88 7/12/88 7/13/88 7/14/88 7/15/88 7/18/88 7/19/88 7/20/88 7/21/88 7/22/88 7/25/88 7/26/88 7/27/88 7/28/88 7/29/88 8/1/88 8/2/88 8/3/88 8/4/88 8/5/88 8/8/88 $43.125 $43.750 $43.625 $43.500 $43.625 $44.000 $44.000 $44.750 $44.625 $45.375 $44.500 $44.625 $45.000 $45.250 $45.375 $46.375 $49.000 $54.375 $54.500 $58.375 $58.125 $57.875 $57.250 $58.000 $58.875 $59.375 $67.750 $68.500 $68.875 $67.625 $67.000 $67.375 $68.250 $72.500 -0.29% 1.45% -0.29% -0.29% 0.29% 0.86% 0.00% 1.70% -0.28% 1.68% -1.93% 0.28% 0.84% 0.56% 0.28% 2.20% 5.66% 10.97% 0.23% 7.11% -0.43% -0.43% -1.08% 1.31% 1.51% 0.85% 14.11% 1.11% 0.55% -1.81% -0.92% 0.56% 1.30% 6.23% 271.67 1.02% 101.02% 275.66 1.47% 101.47% 274.82 -0.30% 99.70% 273.78 -0.38% 99.62% 269.06 -1.72% 98.28% 272.31 1.21% 101.21% 270.98 -0.49% 99.51% 273.50 0.93% 100.93% 271.78 -0.63% 99.37% 275.81 1.48% 101.48% 272.02 -1.37% 98.63% 271.78 -0.09% 99.91% 270.02 -0.65% 99.35% 270.55 0.20% 100.20% 267.85 -1.00% 99.00% 269.32 0.55% 100.55% 270.26 0.35% 100.35% 272.05 0.66% 100.66% 270.51 -0.57% 99.43% 268.47 -0.75% 99.25% 270.00 0.57% 100.57% 266.66 98.76% 263.50 -1.19% 98.81% 264.68 0.45% 100.45% 265.68 0.38% 100.38% 265.19 -0.18% 99.82% 262.50 -1.01% 98.99% 266.02 1.34% 101.34% 272.02 2.26% 102.26% 272.21 0.07% 100.07% 272.06 -0.06% 99.94% 272.98 0.34% 100.34% 271.93 -0.38% 99.62% 271.15 -0.29% 99.71% 14.50% 13.24% (Arithmetic (Geometric Ave. Return) Mean Return) 57 -1.24% 58 59 60 61 62 63 64 65 66 67 68 69 2.92% 1.01% Standard Deviation of Asset Return Standard Deviation of Market Return Mean Market Return or Arithmetic Average Retui = 0.06% x 250 days = II 14.50% Geometric Mean Return = 0.05% 250 days = 13.24% cov (ri, rm) var (rm) 0.0000679422 0.0001007835 beta = = 0.67414 covariance variance 0.0000679422 0.0001007835 CAPM Risk free rate = 10 year Treasury bonds = = RF + B (RM -RF) R (Interco) Cost of Equity of Interco = + 0.67414 ( 0.1450 ). = + or


