please help me find parts a - c
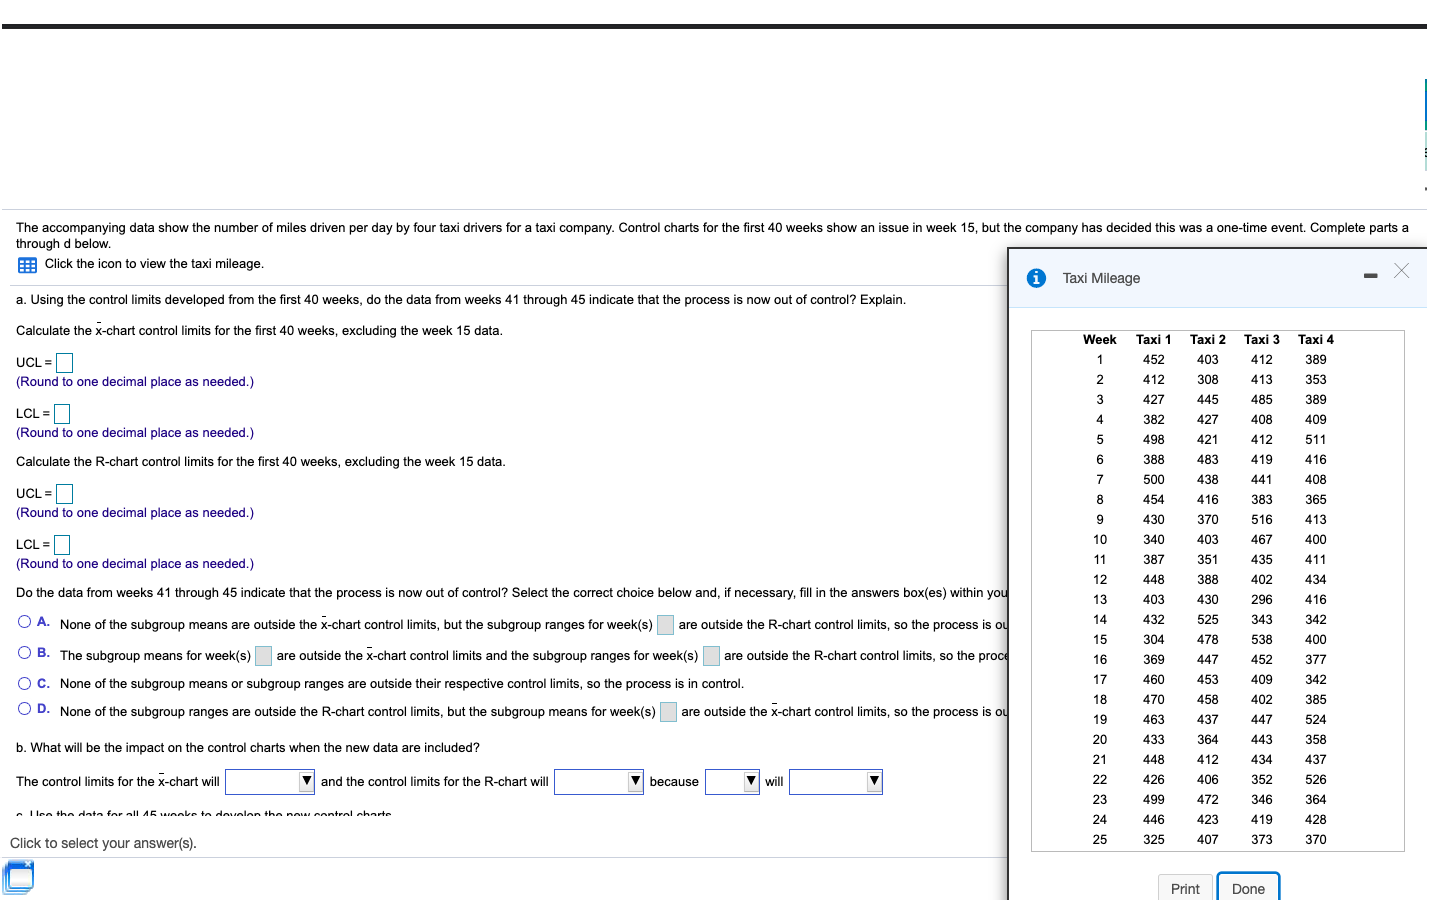
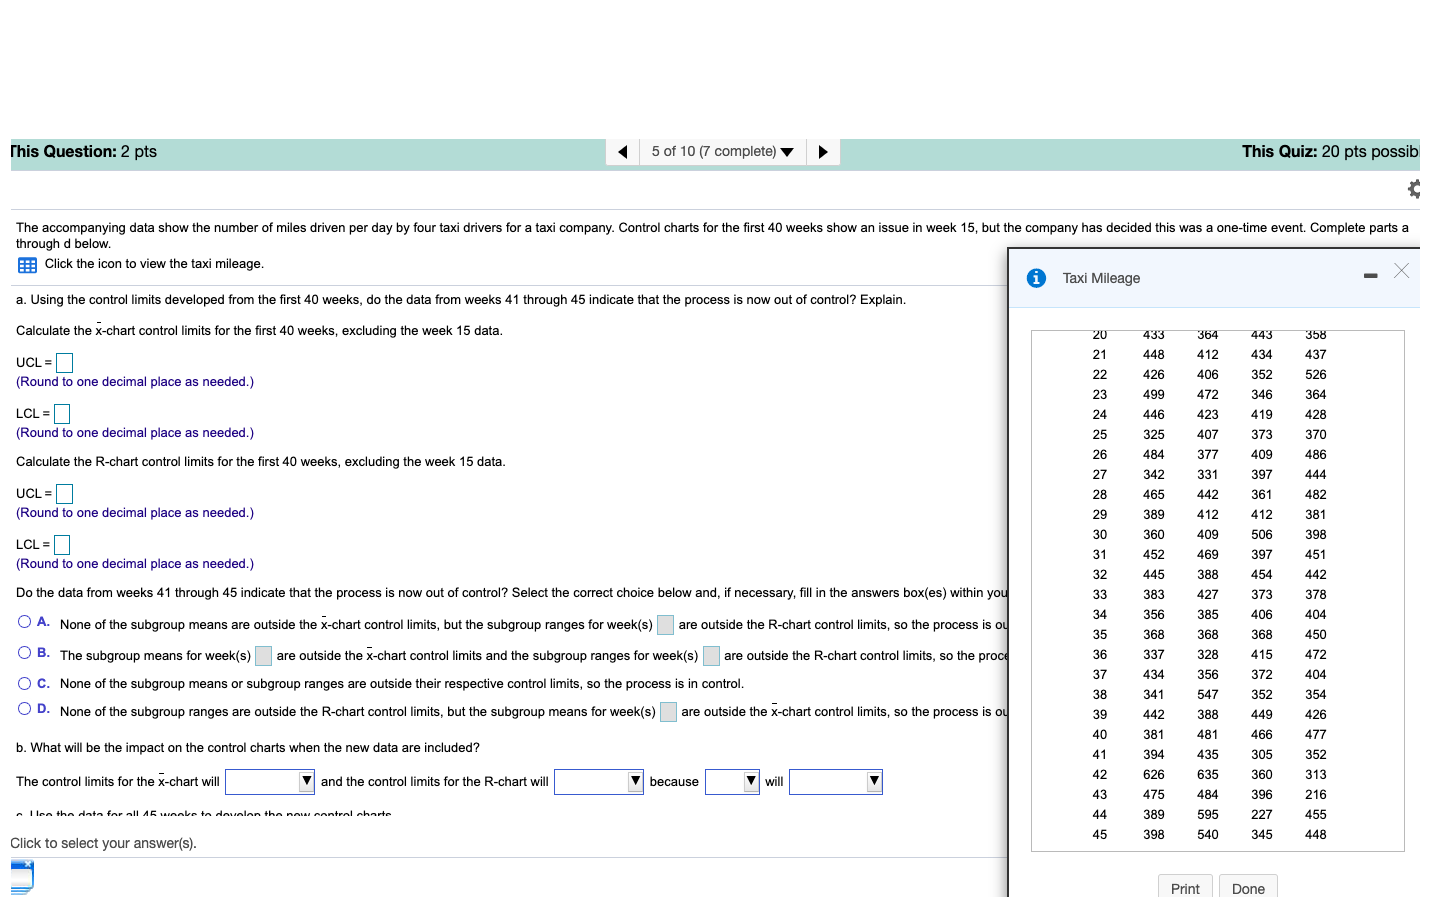
The accompanying data show the number of miles driven per day by four taxi drivers for a taxi company. Control charts for the first 40 weeks show an issue in week 15, but the company has decided this was a one-time event. Complete parts a through d below. Click the icon to view the taxi mileage. i Taxi Mileage - X a. Using the control limits developed from the first 40 weeks, do the data from weeks 41 through 45 indicate that the process is now out of control? Explain. Calculate the x-chart control limits for the first 40 weeks, excluding the week 15 data. Week Taxi 1 Taxi 2 2 Taxi 3 Taxi 4 452 403 412 389 UCL = 1 W N 412 308 413 353 (Round to one decimal place as needed.) 427 445 485 389 LCL = 382 427 408 409 (Round to one decimal place as needed.) 498 421 412 511 483 419 1 16 Calculate the R-chart control limits for the first 40 weeks, excluding the week 15 data. 388 500 438 441 408 UCL = 454 416 383 365 (Round to one decimal place as needed.) 430 370 516 413 340 103 467 400 LCL = 11 387 351 435 411 (Round to one decimal place as needed.) 12 448 388 402 434 Do the data from weeks 41 through 45 indicate that the process is now out of control? Select the correct choice below and, if necessary, fill in the answers box(es) within you 13 403 430 296 416 14 525 J A. None of the subgroup means are outside the x-chart control limits, but the subgroup ranges for week(s) | |are outside the R-chart control limits, so the process is ou 432 343 342 15 304 478 538 400 B. The subgroup means for week(s) are outside the x-chart control limits and the subgroup ranges for week(s) are outside the R-chart control limits, so the proce 16 369 147 452 377 17 460 453 409 342 O C. None of the subgroup means or subgroup ranges are outside their respective control limits, so the process is in control. 18 470 458 402 385 J D. None of the subgroup ranges are outside the R-chart control limits, but the subgroup means for week(s) are outside the x-chart control limits, so the process is ou 19 463 437 447 524 20 433 364 443 358 b. What will be the impact on the control charts when the new data are included? 21 448 412 434 437 and the control limits for the R-chart will because will 22 426 406 352 526 The control limits for the x-chart will 23 499 472 346 364 a I les the data for all ME want " to doualan the now antral charts 24 446 423 419 428 25 325 407 373 370 Click to select your answer(s). Print Done5 of 10 (7 complete) This Quiz: 20 pts possibl This Question: 2 pts The accompanying data show the number of miles driven per day by four taxi drivers for a taxi company. Control charts for the first 40 weeks show an issue in week 15, but the company has decided this was a one-time event. Complete parts a through d below. Click the icon to view the taxi mileage. i Taxi Mileage X a. Using the control limits developed from the first 40 weeks, do the data from weeks 41 through 45 indicate that the process is now out of control? Explain. 20 433 364 443 358 Calculate the x-chart control limits for the first 40 weeks, excluding the week 15 data. 21 448 412 434 437 UCL = 22 426 406 352 526 23 499 472 346 364 (Round to one decimal place as needed.) 24 446 423 419 428 LCL = 25 325 407 373 370 (Round to one decimal place as needed.) 26 484 377 409 486 Calculate the R-chart control limits for the first 40 weeks, excluding the week 15 data. 27 342 331 397 444 28 465 442 361 482 UCL =_ 29 389 412 412 381 (Round to one decimal place as needed.) 30 360 409 506 398 LCL = 31 452 469 397 451 454 442 Round to one decimal place as needed.) 32 445 388 33 383 427 373 378 Do the data from weeks 41 through 45 indicate that the process is now out of control? Select the correct choice below and, if necessary, fill in the answers box(es) within you 34 356 385 406 404 J A. None of the subgroup means are outside the x-chart control limits, but the subgroup ranges for week(s) | |are outside the R-chart control limits, so the process is ou 35 368 368 368 450 36 337 328 415 472 B. The subgroup means for week(s) are outside the x-chart control limits and the subgroup ranges for week(s) |are outside the R-chart control limits, so the proce 37 434 356 372 404 C. None of the subgroup means or subgroup ranges are outside their respective control limits, so the process is in control. 38 341 547 352 354 JD. None of the subgroup ranges are outside the R-chart control limits, but the subgroup means for week(s) are outside the x-chart control limits, so the process is ou 39 442 388 449 426 40 381 481 466 477 41 394 435 305 352 b. What will be the impact on the control charts when the new data are included? 42 626 $35 360 313 The control limits for the x-chart will and the control limits for the R-chart will because will 43 475 484 396 216 44 389 595 227 455 a I les the data for all ME want antral shorts 45 398 540 345 448 Click to select your answer(s). Print Done


