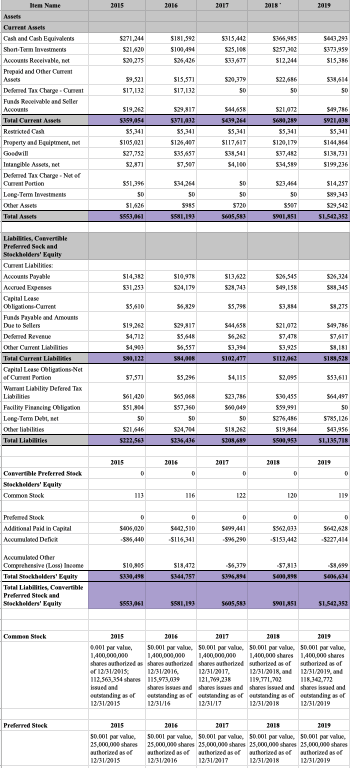
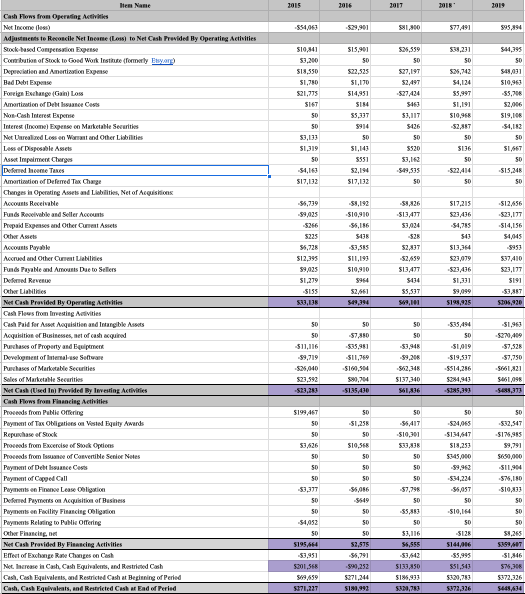
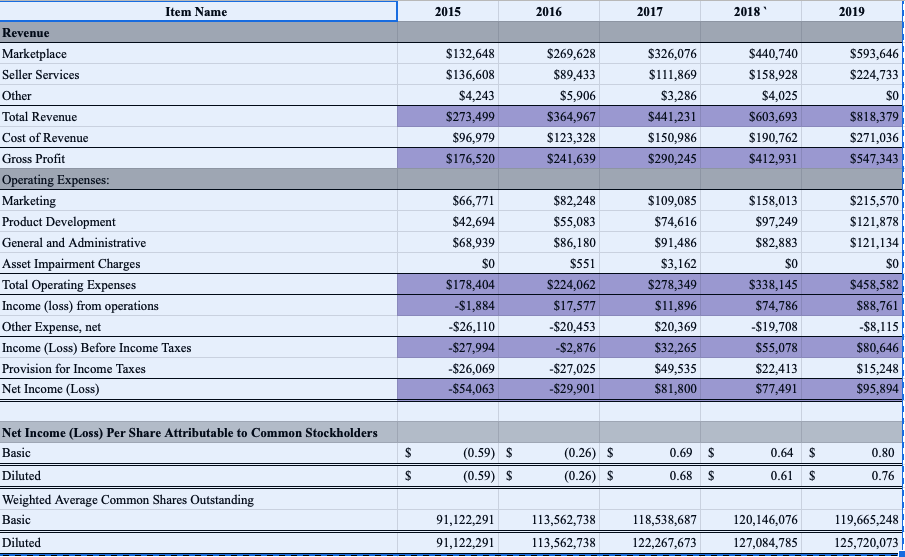
Please help me find the WACC with the following information.


2015 2016 2017 2017 2018 5271,244 5443,293 521,620 520,275 $181,592 $100,494 526,426 5315,442 525,106 533,677 $365,955 5257,302 $12,244 5373,959 515,316 89,521 517,032 515,571 517,02 520,379 SD 538414 SD SD Hem Name Assets Current Assets Cash Cashivalents Shanemovestments Mocownis Receivalent Prepaid and Other Current Assets Defoed Tax Charge. Current Funds Receivable and Seller Accounts Total Current Assets Restricted Cash Property and it Goodwill Intangible Assets, Defoed Tax Charge Net of Cursution Long Term Investments Other And Total Assets 519,262 198454 55,341 S105,021 5371411 55,341 SIM,40T 535657 57,507 541458 5409.264 55,341 51174617 $21,072 5681,289 55,341 $129,179 537412 534,589 549,786 5921438 55,341 $144,364 $139,731 $199,236 SMS 52,871 54,100 551,396 SD $1,626 5553,061 $54,264 SD 5955 SS8,193 SD SD 5720 505,50 523,464 SD 550T 5901851 $14,257 59,343 529,542 51.542,352 513,22 $2,134 $14,312 531,25 $10,97 524,179 525,545 549,15 528,743 588,145 55,610 56,829 59,275 521,073 Liabilities, Convertible Preferred Suckend Stackholders' Equity Current Liais: Accounts Payable More Expenses Capital Lease Obligations Current Funds Payable and Amounts Due to Sellers De Revente Other Current Liabilities Total Current Liabilities Capital Lease Obligations Net Current Portion Warranty Defered Tax Libilities Facility Financing ligt Leng-Term Debut Others Total al Liabilities 519,262 54,712 54,903 59,123 529,31T 55,64 56,557 549,786 57.617 54458 55,262 $3,394 57.478 53.925 S112,963 $102,411 $185,526 57,571 55,296 $4,115 52,095 551,611 561,420 551,814 50 521,646 5122,563 565,068 557,360 SD 524,704 5736,436 $23,786 590,949 SD 51.262 52,489 $30,455 559,991 5276,486 $19,854 5501,953 SD 5785,126 543,956 51.185,715 2015 2016 2017 2015 2019 0 D 0 D 0 Convertible Preferred Stock Stockholders' Equity Common Stock 113 116 120 119 0 0 0 Prefemed Stock Additional Paid in Capital Accumulated De 0 5405,020 59,440 5442,510 -5116,341 0 $199.441 595,290 -5153,412 5227.414 -58.999 510,905 531,495 $18,412 5344,757 36,379 5395,894 5403,895 5005414 Accumulated her Comprehensive Losne Total Stockholders' Equity Tatal Liabilities Convertible Preferred Stock and Stockholders' Equity 5553,061 5581,199 05,583 5901,851 51.542,352 Commen Stock 2016 2017 0,001 par vale So.col por value, so.col por value, so.col por value, so.col por value 1,400.000.000 1,400,000,000 1,400,000,000 1,400,000 shares 1,400,000 shares shoes authorized as shoes authorized shoes authorized started as of started as of 12/31/2015: 12/31/2016 12/31/2017, 12/31/2018 and 12/31/2019, and 112,563 354 shares 115.973,039 121.769,23 119.771.72 118,342.772 issue and shares issues and share issues and share issued and share issued and ating as of outstanding as a starting as a standing as a starting as ek 12/31/2015 13/31/17 13/513019 Preferred Steck 2015 50.00 value 25,000.00 wthorized as a 12/31/2015 2016 2011 2019 50.col por value, 5.col por value, so.col por value, so.col por value, 25,000,000 shares 25,000,000 shares 25,000,000 shares 25,000,000 shares authorized as er wuthorized aser uthorized as or authorized as of 12/31/2016 12/31/2017 12/31/2018 12/31/2019 2015 2016 2017 2018 354,063 -$29,901 $1,900 577.491 595,894 526,559 SD $27,197 52,497 527,424 S10,841 53,200 $13,550 51,710 $21,775 5167 SD SD $3,133 51,319 50 -54,163 517,132 515,901 SD $22,325 S1,170 514951 S184 55,337 5914 SO $1,143 5551 52,194 517,132 SD 5.26,742 54,124 55,997 51,191 510,968 52.88T SD 5136 53,117 5426 SD 5520 544,395 50 549,031 $10,963 -35,706 52,906 $19,108 -54,182 SD 51,667 SD 513,248 SD 549,535 SD SD $22,414 SD -58,826 $13.477 53.424 517,215 $23,436 -54,75 -519,910 56,186 5438 -$3,585 511,199 $10,910 5964 52,83T -56,739 -59,025 5266 5225 56,728 $12,395 89,925 51.279 -5155 533,135 Hem Name Cash Flows from Operating Activities Net Income (1) Adjustments to Reconcile Net Income (Los) to Net Cash Provided By Operating Activities Stock-based Compensation Corbution of Stock to Good Work Institute (formerly Easy.org) Depreciation and Amortizatie Expense Bad Debt Expense Foreign Exchange (Gain Loss Amortistic or Debt Issance Cests NorCash Interest Expense Interest (come) Expense Marketable Securities Net Unrealized Lose Women and Other Libilities Less of Disposable Asie Asset Impairment Charges Defne Te Amortization of Deferred Tax Change Changes in Operating Assets and abilities, Net of Acquisitions Accounts Receive Funds Receivable and Seller Accounts Prepaid Expenses and Other Current Assets Other Awes Accounts Payable Accrued and Other Current Liabilities Funds Payable and Amounts Due to Sellers De Revende Other Libilities Net Cash Provided By Operating Activities Cash Flows from Malvities Cash Paid for Asset Mequisition and Intangible Assets Acquisition of Businesses, et of cash equired Puhases of Property and pro Development of Internalse Sellware Purchases of Marketable Securities Sales of Marketable Securities Net Cash (Used In Provided By Investing Activities Cash Flows from Financing Acties Proceeds from Pale Omring Payment of Tax Obligations on Vested Equity Awards Repushase of Stock Proceeds from Excercise of Stock Ops Proceeds from Issuance of Convertine Serie Notes Payment of Debt Issance Cests Payment of Copped Call Pays France Lease Bolig Defend Payments on Acquisition of Business Payments on Facility Financing Obligation Payments Relating to Pulk Offering Other Facing, Net Cash Provided By Financing Activities Effect of Exchange Rate Changes on Cash Net Increase in Cash Cash Equivalents, and Restricted Cash Cash Cash Equivalents and Restricted Cash at Beginning of Peried Cash, Casa Equivalents, and Restricted Cash u End of Period 513417 5434 -512,656 $23,177 $14,156 54.945 -5953 537410 $23,177 5191 -33,88T S206,920 513,364 523,479 -523,436 51,331 59,099 $199,925 55,53T SD $35.494 -51,963 -S200,400 SD SD SD $11,116 -59,719 526,040 523,592 -523,280 SO -57,810 -535,91 -511,769 -$160,504 590,704 5135.430 -59,206 562,34 SD -51,019 -519,537 5514,286 -57,750 -5661,821 $461,098 -5489,373 $137,340 561,836 -S185,39 $191,467 SD SD 53.626 SD -51,256 SD $10,568 SO SD SD -56,056 SD 55,417 -510,301 533,838 SD SD SD -57,798 SD SD 50 -33,397 SD 50 34,952 SD 5195454 $3.951 SD -524,965 -5134,547 513,253 5345,000 -99,95 -534,224 -54057 SD -510,164 SD 5128 5141,016 55,995 551,543 $320,753 5372,326 SD 532,547 -S144,915 59,791 5630,000 -511,904 575,180 $10,233 50 SD SD 59,265 539947 -51,846 50 -55,883 SD $3,116 56.555 SD SD SD 52,575 55,791 -590,252 5271.244 $184,993 575,306 5201,566 509,659 5171,227 $133,850 $18,933 5300,250 5372,326 5449,434 2015 2016 2017 2018" 2019 $132,648 $136,608 $4,243 $273,499 $96,979 $176,520 $269,628 $89,433 $5,906 $364,967 $123,328 $241,639 $326,076 $111,869 $3,286 $441,231 $150,986 $290,245 $440,740 $158,928 $4,025 $603,693 $190,762 $412,931 $593,646 $224,733 $0 $818,379 $271,036 $547,343 Item Name Revenue Marketplace Seller Services Other Total Revenue Cost of Revenue Gross Profit Operating Expenses: Marketing Product Development General and Administrative Asset Impairment Charges Total Operating Expenses Income (loss) from operations Other Expense, net Income (Loss) Before Income Taxes Provision for Income Taxes Net Income (Loss) $66,771 $42,694 $68,939 $0 $178,404 -$1,884 $26,110 -$27,994 $26,069 -$54,063 $82,248 $55,083 $86,180 $551 $224,062 $17,577 -$20,453 -$2,876 $27,025 -$29,901 $109,085 $74,616 $91,486 $3,162 $278,349 $11,896 $20,369 $32,265 $49,535 $81,800 $158,013 $97,249 $82,883 $0 $338,145 $74,786 -$19,708 $55,078 $22,413 $77,491 $215,570 $121,878 $121,134 $0 $458,582 $88,761 $8,115 $80,646 $15,248 $95,894 $ 0.69 $ 0.64 $ 0.80 Net Income (Loss) Per Share Attributable to Common Stockholders Basic Diluted Weighted Average Common Shares Outstanding Basic (0.59) $ (0.59) $ (0.26) $ (0.26) $ $ 0.68 $ 0.61 $ 0.76 91, 122,291 91,122,291 113,562,738 113,562,738 118,538,687 122,267,673 120, 146,076 127,084,785 119,665,248 125,720,073 Diluted 2015 2016 2017 2017 2018 5271,244 5443,293 521,620 520,275 $181,592 $100,494 526,426 5315,442 525,106 533,677 $365,955 5257,302 $12,244 5373,959 515,316 89,521 517,032 515,571 517,02 520,379 SD 538414 SD SD Hem Name Assets Current Assets Cash Cashivalents Shanemovestments Mocownis Receivalent Prepaid and Other Current Assets Defoed Tax Charge. Current Funds Receivable and Seller Accounts Total Current Assets Restricted Cash Property and it Goodwill Intangible Assets, Defoed Tax Charge Net of Cursution Long Term Investments Other And Total Assets 519,262 198454 55,341 S105,021 5371411 55,341 SIM,40T 535657 57,507 541458 5409.264 55,341 51174617 $21,072 5681,289 55,341 $129,179 537412 534,589 549,786 5921438 55,341 $144,364 $139,731 $199,236 SMS 52,871 54,100 551,396 SD $1,626 5553,061 $54,264 SD 5955 SS8,193 SD SD 5720 505,50 523,464 SD 550T 5901851 $14,257 59,343 529,542 51.542,352 513,22 $2,134 $14,312 531,25 $10,97 524,179 525,545 549,15 528,743 588,145 55,610 56,829 59,275 521,073 Liabilities, Convertible Preferred Suckend Stackholders' Equity Current Liais: Accounts Payable More Expenses Capital Lease Obligations Current Funds Payable and Amounts Due to Sellers De Revente Other Current Liabilities Total Current Liabilities Capital Lease Obligations Net Current Portion Warranty Defered Tax Libilities Facility Financing ligt Leng-Term Debut Others Total al Liabilities 519,262 54,712 54,903 59,123 529,31T 55,64 56,557 549,786 57.617 54458 55,262 $3,394 57.478 53.925 S112,963 $102,411 $185,526 57,571 55,296 $4,115 52,095 551,611 561,420 551,814 50 521,646 5122,563 565,068 557,360 SD 524,704 5736,436 $23,786 590,949 SD 51.262 52,489 $30,455 559,991 5276,486 $19,854 5501,953 SD 5785,126 543,956 51.185,715 2015 2016 2017 2015 2019 0 D 0 D 0 Convertible Preferred Stock Stockholders' Equity Common Stock 113 116 120 119 0 0 0 Prefemed Stock Additional Paid in Capital Accumulated De 0 5405,020 59,440 5442,510 -5116,341 0 $199.441 595,290 -5153,412 5227.414 -58.999 510,905 531,495 $18,412 5344,757 36,379 5395,894 5403,895 5005414 Accumulated her Comprehensive Losne Total Stockholders' Equity Tatal Liabilities Convertible Preferred Stock and Stockholders' Equity 5553,061 5581,199 05,583 5901,851 51.542,352 Commen Stock 2016 2017 0,001 par vale So.col por value, so.col por value, so.col por value, so.col por value 1,400.000.000 1,400,000,000 1,400,000,000 1,400,000 shares 1,400,000 shares shoes authorized as shoes authorized shoes authorized started as of started as of 12/31/2015: 12/31/2016 12/31/2017, 12/31/2018 and 12/31/2019, and 112,563 354 shares 115.973,039 121.769,23 119.771.72 118,342.772 issue and shares issues and share issues and share issued and share issued and ating as of outstanding as a starting as a standing as a starting as ek 12/31/2015 13/31/17 13/513019 Preferred Steck 2015 50.00 value 25,000.00 wthorized as a 12/31/2015 2016 2011 2019 50.col por value, 5.col por value, so.col por value, so.col por value, 25,000,000 shares 25,000,000 shares 25,000,000 shares 25,000,000 shares authorized as er wuthorized aser uthorized as or authorized as of 12/31/2016 12/31/2017 12/31/2018 12/31/2019 2015 2016 2017 2018 354,063 -$29,901 $1,900 577.491 595,894 526,559 SD $27,197 52,497 527,424 S10,841 53,200 $13,550 51,710 $21,775 5167 SD SD $3,133 51,319 50 -54,163 517,132 515,901 SD $22,325 S1,170 514951 S184 55,337 5914 SO $1,143 5551 52,194 517,132 SD 5.26,742 54,124 55,997 51,191 510,968 52.88T SD 5136 53,117 5426 SD 5520 544,395 50 549,031 $10,963 -35,706 52,906 $19,108 -54,182 SD 51,667 SD 513,248 SD 549,535 SD SD $22,414 SD -58,826 $13.477 53.424 517,215 $23,436 -54,75 -519,910 56,186 5438 -$3,585 511,199 $10,910 5964 52,83T -56,739 -59,025 5266 5225 56,728 $12,395 89,925 51.279 -5155 533,135 Hem Name Cash Flows from Operating Activities Net Income (1) Adjustments to Reconcile Net Income (Los) to Net Cash Provided By Operating Activities Stock-based Compensation Corbution of Stock to Good Work Institute (formerly Easy.org) Depreciation and Amortizatie Expense Bad Debt Expense Foreign Exchange (Gain Loss Amortistic or Debt Issance Cests NorCash Interest Expense Interest (come) Expense Marketable Securities Net Unrealized Lose Women and Other Libilities Less of Disposable Asie Asset Impairment Charges Defne Te Amortization of Deferred Tax Change Changes in Operating Assets and abilities, Net of Acquisitions Accounts Receive Funds Receivable and Seller Accounts Prepaid Expenses and Other Current Assets Other Awes Accounts Payable Accrued and Other Current Liabilities Funds Payable and Amounts Due to Sellers De Revende Other Libilities Net Cash Provided By Operating Activities Cash Flows from Malvities Cash Paid for Asset Mequisition and Intangible Assets Acquisition of Businesses, et of cash equired Puhases of Property and pro Development of Internalse Sellware Purchases of Marketable Securities Sales of Marketable Securities Net Cash (Used In Provided By Investing Activities Cash Flows from Financing Acties Proceeds from Pale Omring Payment of Tax Obligations on Vested Equity Awards Repushase of Stock Proceeds from Excercise of Stock Ops Proceeds from Issuance of Convertine Serie Notes Payment of Debt Issance Cests Payment of Copped Call Pays France Lease Bolig Defend Payments on Acquisition of Business Payments on Facility Financing Obligation Payments Relating to Pulk Offering Other Facing, Net Cash Provided By Financing Activities Effect of Exchange Rate Changes on Cash Net Increase in Cash Cash Equivalents, and Restricted Cash Cash Cash Equivalents and Restricted Cash at Beginning of Peried Cash, Casa Equivalents, and Restricted Cash u End of Period 513417 5434 -512,656 $23,177 $14,156 54.945 -5953 537410 $23,177 5191 -33,88T S206,920 513,364 523,479 -523,436 51,331 59,099 $199,925 55,53T SD $35.494 -51,963 -S200,400 SD SD SD $11,116 -59,719 526,040 523,592 -523,280 SO -57,810 -535,91 -511,769 -$160,504 590,704 5135.430 -59,206 562,34 SD -51,019 -519,537 5514,286 -57,750 -5661,821 $461,098 -5489,373 $137,340 561,836 -S185,39 $191,467 SD SD 53.626 SD -51,256 SD $10,568 SO SD SD -56,056 SD 55,417 -510,301 533,838 SD SD SD -57,798 SD SD 50 -33,397 SD 50 34,952 SD 5195454 $3.951 SD -524,965 -5134,547 513,253 5345,000 -99,95 -534,224 -54057 SD -510,164 SD 5128 5141,016 55,995 551,543 $320,753 5372,326 SD 532,547 -S144,915 59,791 5630,000 -511,904 575,180 $10,233 50 SD SD 59,265 539947 -51,846 50 -55,883 SD $3,116 56.555 SD SD SD 52,575 55,791 -590,252 5271.244 $184,993 575,306 5201,566 509,659 5171,227 $133,850 $18,933 5300,250 5372,326 5449,434 2015 2016 2017 2018" 2019 $132,648 $136,608 $4,243 $273,499 $96,979 $176,520 $269,628 $89,433 $5,906 $364,967 $123,328 $241,639 $326,076 $111,869 $3,286 $441,231 $150,986 $290,245 $440,740 $158,928 $4,025 $603,693 $190,762 $412,931 $593,646 $224,733 $0 $818,379 $271,036 $547,343 Item Name Revenue Marketplace Seller Services Other Total Revenue Cost of Revenue Gross Profit Operating Expenses: Marketing Product Development General and Administrative Asset Impairment Charges Total Operating Expenses Income (loss) from operations Other Expense, net Income (Loss) Before Income Taxes Provision for Income Taxes Net Income (Loss) $66,771 $42,694 $68,939 $0 $178,404 -$1,884 $26,110 -$27,994 $26,069 -$54,063 $82,248 $55,083 $86,180 $551 $224,062 $17,577 -$20,453 -$2,876 $27,025 -$29,901 $109,085 $74,616 $91,486 $3,162 $278,349 $11,896 $20,369 $32,265 $49,535 $81,800 $158,013 $97,249 $82,883 $0 $338,145 $74,786 -$19,708 $55,078 $22,413 $77,491 $215,570 $121,878 $121,134 $0 $458,582 $88,761 $8,115 $80,646 $15,248 $95,894 $ 0.69 $ 0.64 $ 0.80 Net Income (Loss) Per Share Attributable to Common Stockholders Basic Diluted Weighted Average Common Shares Outstanding Basic (0.59) $ (0.59) $ (0.26) $ (0.26) $ $ 0.68 $ 0.61 $ 0.76 91, 122,291 91,122,291 113,562,738 113,562,738 118,538,687 122,267,673 120, 146,076 127,084,785 119,665,248 125,720,073 Diluted


