Answered step by step
Verified Expert Solution
Question
1 Approved Answer
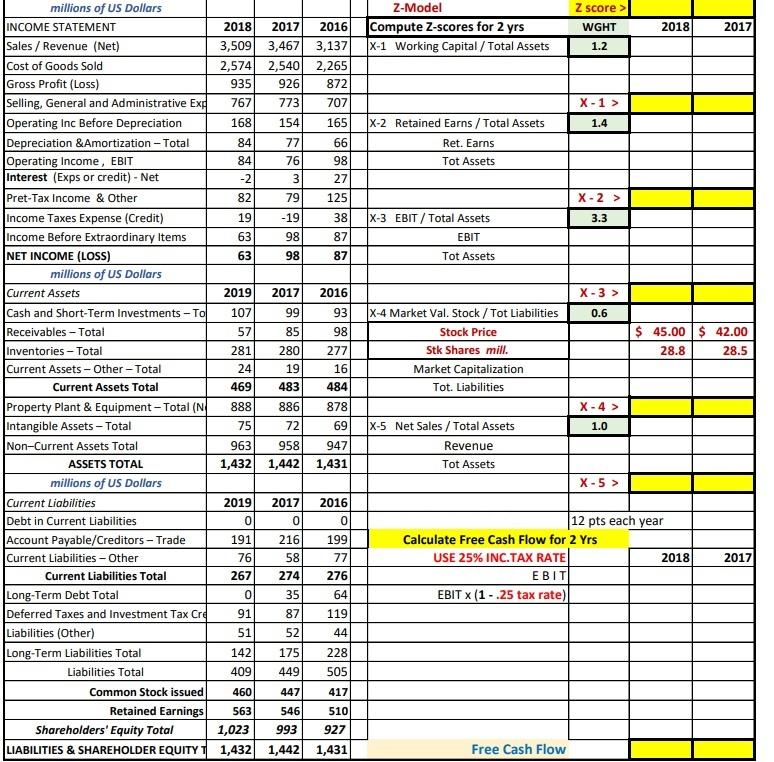
Please help me find the z scores and free cash flow will leave a thumbs up thank you Z score > Z-Model Compute Z-scores for

Please help me find the z scores and free cash flow will leave a thumbs up thank you
Z score > Z-Model Compute Z-scores for 2 yrs X-1 Working Capital / Total Assets WGHT 2018 2017 1.2 X-1 > 1.4 |X-2 Retained Earns/Total Assets Ret. Earns NIN Tot Assets X-2 > 3.3 ]] X-3 EBIT/Total Assets EBIT 0000 Tot Assets X-3 > 0.6 millions of US Dollars INCOME STATEMENT 2018 2017 2016 Sales / Revenue (Net) 3,509 3,467 3,137 Cost of Goods Sold 2,574 2,540 2,265 Gross Profit (Loss) 935 926 872 Selling, General and Administrative Exp 767 773 707 Operating Inc Before Depreciation 168 154 165 Depreciation &Amortization - Total 84 77 66 Operating Income, EBIT 84 76 98 Interest (Exps or credit) - Net -2 3 27 Pret-Tax Income & Other 82 79 125 Income Taxes Expense (Credit) 19 -19 38 Income Before Extraordinary Items 63 98 87 NET INCOME (LOSS) 63 98 87 millions of US Dollars Current Assets 2019 2017 2016) Cash and Short-Term Investments - To 107 99 93 Receivables - Total 57 85 98 Inventories - Total 281 280 277 Current Assets - Other - Total 24 19 16 Current Assets Total 469 483 484 Property Plant & Equipment - Total (N 888 886 878 Intangible Assets - Total 75 72 69 Non-Current Assets Total 963 958 947 ASSETS TOTAL 1,432 1,442 1,431 millions of US Dollars Current Liabilities 2019 2017 2016 Debt in Current Liabilities 0 0 Account Payable/Creditors - Trade 191 216 199 Current Liabilities - Other 76 58 77 Current Liabilities Total 267 274 276 Long-Term Debt Total 0 35 64 Deferred Taxes and Investment Tax Cre 91 87 119 Liabilities (Other) 51 52 44 Long-Term Liabilities Total 142 175 228 Liabilities Total 409 449 505 Common Stock issued 460 447 417 Retained Earnings 563 546 510 Shareholders' Equity Total 1,023 993 927 LIABILITIES & SHAREHOLDER EQUITYT 1,432 1,442 1,431 X-4 Market Val. Stock /Tot Liabilities Stock Price Stk Shares mill. Market Capitalization Tot. Liabilities $ 45.00 $ 42.00 28.8 28.5 X-4 > 1.0 X-5 Net Sales/Total Assets Revenue Tot Assets X-5 > o | 6 ml 12 pts each year Calculate Free Cash Flow for 2 yrs USE 25% INC.TAX RATE 2018 EBIT EBIT X(1 - 25 tax rate) 2017 lolu Free Cash Flow Z score > Z-Model Compute Z-scores for 2 yrs X-1 Working Capital / Total Assets WGHT 2018 2017 1.2 X-1 > 1.4 |X-2 Retained Earns/Total Assets Ret. Earns NIN Tot Assets X-2 > 3.3 ]] X-3 EBIT/Total Assets EBIT 0000 Tot Assets X-3 > 0.6 millions of US Dollars INCOME STATEMENT 2018 2017 2016 Sales / Revenue (Net) 3,509 3,467 3,137 Cost of Goods Sold 2,574 2,540 2,265 Gross Profit (Loss) 935 926 872 Selling, General and Administrative Exp 767 773 707 Operating Inc Before Depreciation 168 154 165 Depreciation &Amortization - Total 84 77 66 Operating Income, EBIT 84 76 98 Interest (Exps or credit) - Net -2 3 27 Pret-Tax Income & Other 82 79 125 Income Taxes Expense (Credit) 19 -19 38 Income Before Extraordinary Items 63 98 87 NET INCOME (LOSS) 63 98 87 millions of US Dollars Current Assets 2019 2017 2016) Cash and Short-Term Investments - To 107 99 93 Receivables - Total 57 85 98 Inventories - Total 281 280 277 Current Assets - Other - Total 24 19 16 Current Assets Total 469 483 484 Property Plant & Equipment - Total (N 888 886 878 Intangible Assets - Total 75 72 69 Non-Current Assets Total 963 958 947 ASSETS TOTAL 1,432 1,442 1,431 millions of US Dollars Current Liabilities 2019 2017 2016 Debt in Current Liabilities 0 0 Account Payable/Creditors - Trade 191 216 199 Current Liabilities - Other 76 58 77 Current Liabilities Total 267 274 276 Long-Term Debt Total 0 35 64 Deferred Taxes and Investment Tax Cre 91 87 119 Liabilities (Other) 51 52 44 Long-Term Liabilities Total 142 175 228 Liabilities Total 409 449 505 Common Stock issued 460 447 417 Retained Earnings 563 546 510 Shareholders' Equity Total 1,023 993 927 LIABILITIES & SHAREHOLDER EQUITYT 1,432 1,442 1,431 X-4 Market Val. Stock /Tot Liabilities Stock Price Stk Shares mill. Market Capitalization Tot. Liabilities $ 45.00 $ 42.00 28.8 28.5 X-4 > 1.0 X-5 Net Sales/Total Assets Revenue Tot Assets X-5 > o | 6 ml 12 pts each year Calculate Free Cash Flow for 2 yrs USE 25% INC.TAX RATE 2018 EBIT EBIT X(1 - 25 tax rate) 2017 lolu Free Cash FlowStep by Step Solution
There are 3 Steps involved in it
Step: 1

Get Instant Access to Expert-Tailored Solutions
See step-by-step solutions with expert insights and AI powered tools for academic success
Step: 2

Step: 3

Ace Your Homework with AI
Get the answers you need in no time with our AI-driven, step-by-step assistance
Get Started


