

Answered step by step
Verified Expert Solution
Question
1 Approved Answer
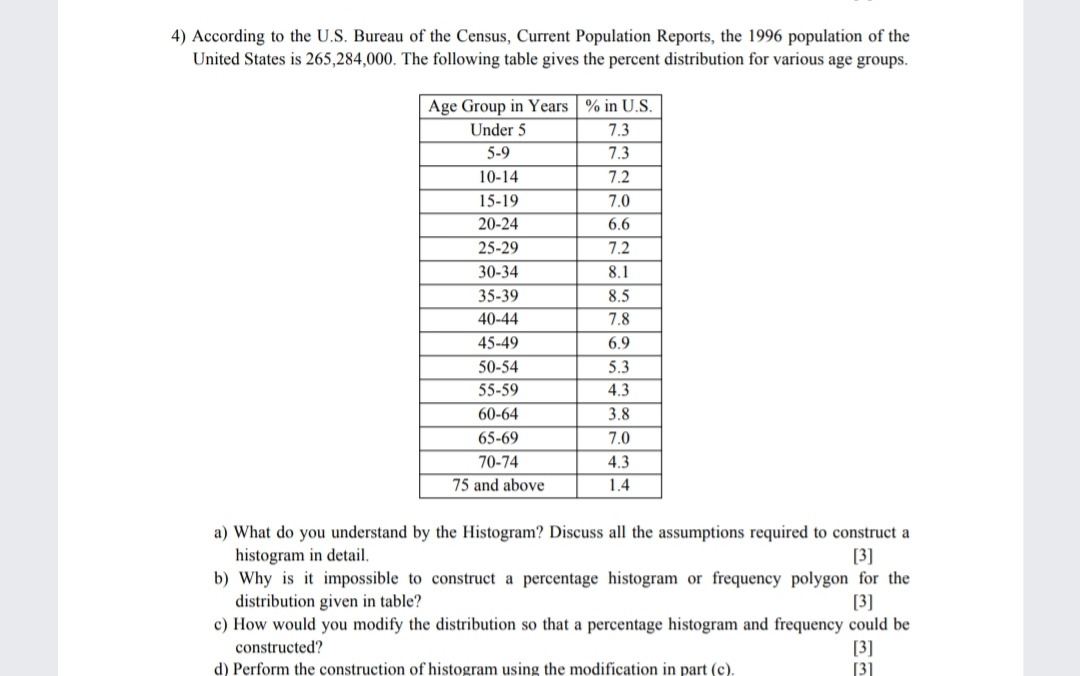
Please help me for solving this question of statistics subject as soon as possible and please explain each and every aspect of it. 4) According
Please help me for solving this question of statistics subject as soon as possible and please explain each and every aspect of it.
Step by Step Solution
There are 3 Steps involved in it
Step: 1

Get Instant Access to Expert-Tailored Solutions
See step-by-step solutions with expert insights and AI powered tools for academic success
Step: 2

Step: 3
Ace Your Homework with AI
Get the answers you need in no time with our AI-driven, step-by-step assistance
Get Started