please help me make these graphs!
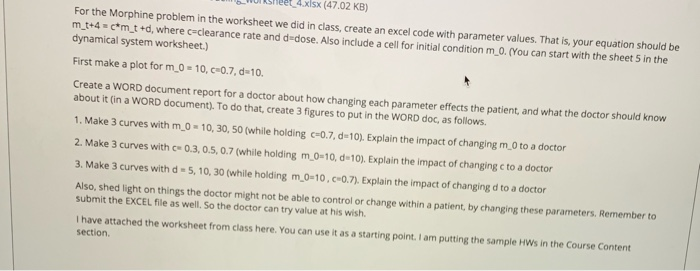
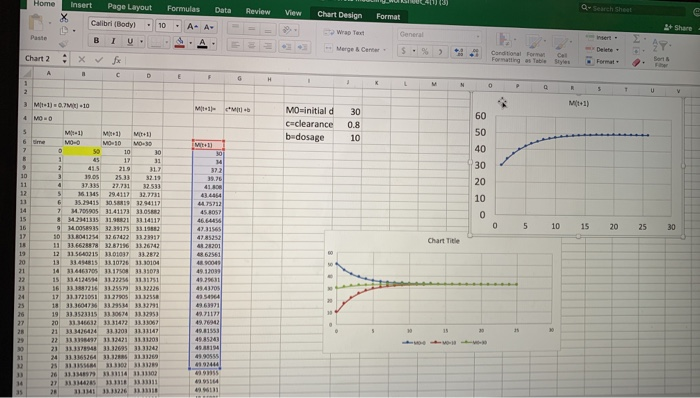
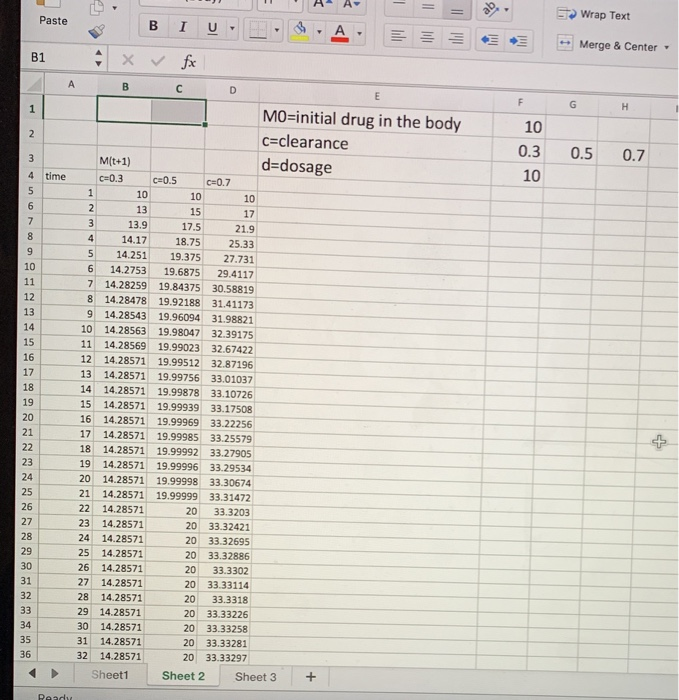
4.xlsx (47.02 KB) For the Morphine problem in the worksheet we did in class, create an excel code with parameter values. That is your equation should be m_t+4=cm_t+d, where c-clearance rate and dedose. Also include a cell for initial condition m 0. (You can start with the sheet 5 in the dynamical system worksheet.) First make a plot for m_0 = 10, 0.7, d=10. Create a WORD document report for a doctor about how changing each parameter effects the patient, and what the doctor should know about it in a WORD document). To do that, create 3 figures to put in the WORD doc, as follows. 1. Make 3 curves with m 0-10, 30, 50 (while holding C=0.7, de 10). Explain the impact of changing m 0 to a doctor 2. Make 3 curves with c 0.3, 0.5, 0.7 (while holding m_0-10, 10). Explain the impact of changing cto a doctor 3. Make 3 curves with d=5, 10, 30 (while holding m 0-10.0-0.7). Explain the impact of changing d to a doctor Also, shed light on things the doctor might not be able to control or change within a patient, by changing these parameters. Remember to submit the EXCEL file as well. So the doctor can try value at his wish I have attached the worksheet from class here. You can use it as a starting point. I am putting the sample HWs in the Course Content section Review Q- Search Shast View Chart Design Home . Paste Chart 2 Data - Format Insert Page Layout Formulas Calibri (Bodyl . 10 . A- A B I V . A x x 2+ Share Wrap Tour - Merge Center S. Conditional Form matting as Table Styles Format 2. Sort M1 Mb MO-initial d C=clearance bedosage 30 0.8 10 MT+1) 25.333219 5 294117 32.773 7 .705905 31.41173 33.5 9 14.0058935 32.39175 33 1982 0 5 10 15 20 25 30 11 33.6628878 32.87196 33.26742 13 33444815 33102263130104 18 33.360475 33.295343332991 20 31.346632 33.31472 33.33067 21 333426424 110 1111147 21 33.3378943 33.32695 3131742 24333365264 332 33326 5313 3 13300 13129 26 1133499331110 111102 273314475 13 333311 28 31 3322633311 D AA Wrap Text Paste B I U. $.A. Merge & Center B1 G H 10 0.3 10 0.5 0.7 time MO=initial drug in the body C=clearance M(t+1) d=dosage 0.3 0.5 c=0.7 10 10 10 13 15 17 13.9 17.5 21.9 4 14.17 18.75 25.33 5 14.251 19.375 27.731 6 14.2753 19.6875 29.4117 7 14.28259 19.84375 30.58819 8 14.28478 19.92188 31.41173 9 14.28543 19.96094 31.98821 10 14.28563 19.98047 32.39175 11 14.28569 19.99023 32.67422 12 14.28571 19.99512 32.87196 13 14.28571 19.99756 33.01037 14 14.28571 19.99878 33.10726 15 14.28571 19.99939 33.17508 16 14.28571 19.99969 33.22256 17 14.28571 19.99985 33.25579 18 14.28571 19.99992 33.27905 19 14.28571 19.99996 33.29534 20 14.28571 19.99998 33.30674 21 14.28571 19.99999 33.31472 22 14.28571 20 33.3203 23 14.28571 20 33.32421 24 14.28571 20 33.32695 25 14.28571 20 33.32886 26 14.28571 20 33.3302 27 14.28571 20 33.33114 28 14.28571 20 33.3318 29 14.28571 20 33.33226 30 14.28571 20 33.33258 31 14.28571 20 33.33281 32 14.28571 20 33.33297 Sheet1 Sheet 2 Sheet 3 + Read 4.xlsx (47.02 KB) For the Morphine problem in the worksheet we did in class, create an excel code with parameter values. That is your equation should be m_t+4=cm_t+d, where c-clearance rate and dedose. Also include a cell for initial condition m 0. (You can start with the sheet 5 in the dynamical system worksheet.) First make a plot for m_0 = 10, 0.7, d=10. Create a WORD document report for a doctor about how changing each parameter effects the patient, and what the doctor should know about it in a WORD document). To do that, create 3 figures to put in the WORD doc, as follows. 1. Make 3 curves with m 0-10, 30, 50 (while holding C=0.7, de 10). Explain the impact of changing m 0 to a doctor 2. Make 3 curves with c 0.3, 0.5, 0.7 (while holding m_0-10, 10). Explain the impact of changing cto a doctor 3. Make 3 curves with d=5, 10, 30 (while holding m 0-10.0-0.7). Explain the impact of changing d to a doctor Also, shed light on things the doctor might not be able to control or change within a patient, by changing these parameters. Remember to submit the EXCEL file as well. So the doctor can try value at his wish I have attached the worksheet from class here. You can use it as a starting point. I am putting the sample HWs in the Course Content section Review Q- Search Shast View Chart Design Home . Paste Chart 2 Data - Format Insert Page Layout Formulas Calibri (Bodyl . 10 . A- A B I V . A x x 2+ Share Wrap Tour - Merge Center S. Conditional Form matting as Table Styles Format 2. Sort M1 Mb MO-initial d C=clearance bedosage 30 0.8 10 MT+1) 25.333219 5 294117 32.773 7 .705905 31.41173 33.5 9 14.0058935 32.39175 33 1982 0 5 10 15 20 25 30 11 33.6628878 32.87196 33.26742 13 33444815 33102263130104 18 33.360475 33.295343332991 20 31.346632 33.31472 33.33067 21 333426424 110 1111147 21 33.3378943 33.32695 3131742 24333365264 332 33326 5313 3 13300 13129 26 1133499331110 111102 273314475 13 333311 28 31 3322633311 D AA Wrap Text Paste B I U. $.A. Merge & Center B1 G H 10 0.3 10 0.5 0.7 time MO=initial drug in the body C=clearance M(t+1) d=dosage 0.3 0.5 c=0.7 10 10 10 13 15 17 13.9 17.5 21.9 4 14.17 18.75 25.33 5 14.251 19.375 27.731 6 14.2753 19.6875 29.4117 7 14.28259 19.84375 30.58819 8 14.28478 19.92188 31.41173 9 14.28543 19.96094 31.98821 10 14.28563 19.98047 32.39175 11 14.28569 19.99023 32.67422 12 14.28571 19.99512 32.87196 13 14.28571 19.99756 33.01037 14 14.28571 19.99878 33.10726 15 14.28571 19.99939 33.17508 16 14.28571 19.99969 33.22256 17 14.28571 19.99985 33.25579 18 14.28571 19.99992 33.27905 19 14.28571 19.99996 33.29534 20 14.28571 19.99998 33.30674 21 14.28571 19.99999 33.31472 22 14.28571 20 33.3203 23 14.28571 20 33.32421 24 14.28571 20 33.32695 25 14.28571 20 33.32886 26 14.28571 20 33.3302 27 14.28571 20 33.33114 28 14.28571 20 33.3318 29 14.28571 20 33.33226 30 14.28571 20 33.33258 31 14.28571 20 33.33281 32 14.28571 20 33.33297 Sheet1 Sheet 2 Sheet 3 + Read