Please help me only if you really know how to solve it as I am stuck and I cannot solve these questions. Dont give me
Please help me only if you really know how to solve it as I am stuck and I cannot solve these questions. Dont give me random answers please. You can use any software to solve it if it's easier ( we use R). If I am satisfied, i will also make sure you are satisfied too.
Link to textbook if needed with the content: https://drive.google.com/file/d/1ptM7Pzw8e364cZpwdQXU30GVhrQc1AZ7/view?usp=sharing
Questions:
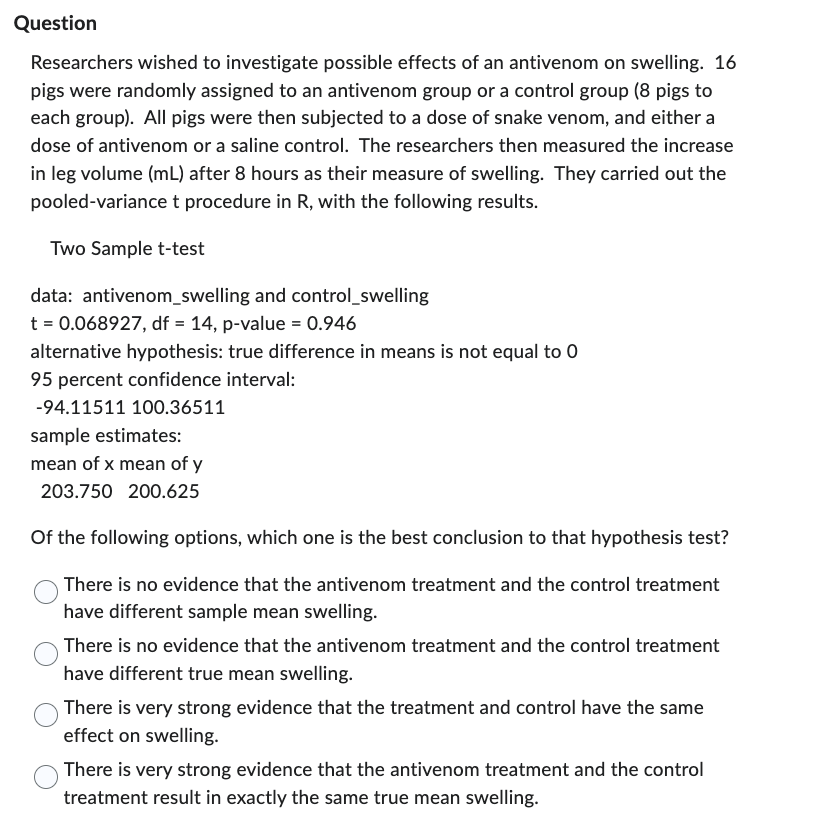
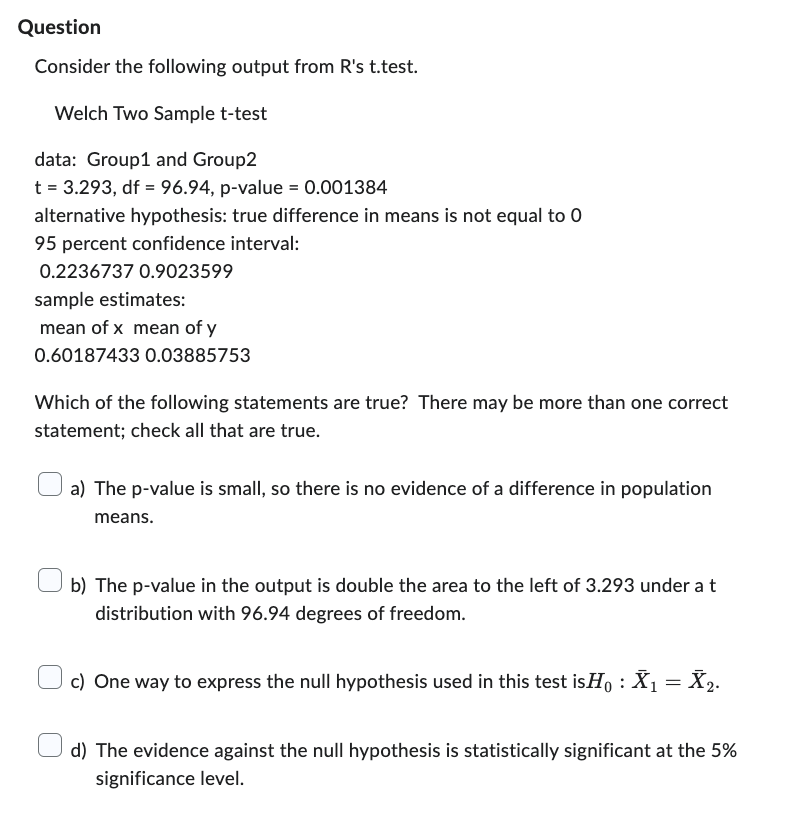
Question Researchers wished to investigate possible effects of an antivenom on swelling. 16 pigs were randomly assigned to an antivenom group or a control group [3 pigs to each group). All pigs were then subjected to a dose of snake venom, and either a dose of antivenom or a saline control. The researchers then measured the increase in leg volume (mL) after 8 hours as their measure of swelling. They carried out the pooled-variance t procedure in R, with the following results. Two Sample t-test data: antivenom_swelling and control_swelling t = 0.068927, df = 14, p-value = 0.946 alternative hypothesis: true difference in means is not equal to 0 95 percent confidence interval: -94.11511 100.36511 sample estimates: mean of x mean of y 203.750 200.625 Of the following options, which one is the best conclusion to that hypothesis test? ("3, There is no evidence that the antivenom treatment and the control treatment ' have different sample mean swelling. ("'3 There is no evidence that the antivenom treatment and the control treatment J have different true mean swelling. (\""1 There is very strong evidence that the treatment and control have the same H effect on swelling. (\"3, There is very strong evidence that the antivenom treatment and the control \\. ' treatment result in exactly the same true mean swelling. Question Consider the following output from R's t.test. Welch Two Sample t-test data: Groupl and Group2 t = 3.293, df = 96.94, p-value = 0.001384 alternative hypothesis: true difference in means is not equal to 0 95 percent confidence interval: 0.2236737 0.9023599 sample estimates: mean of x mean of y 0.60187433 0.03885753 Which of the following statements are true? There may be more than one correct statement; check all that are true. l._.' a} The p-value is small. so there is no evidence of a difference in population means. l:' b) The p-value in the output is double the area to the left of 3.293 under a t distribution with 96.94 degrees of freedom. Cl c) One way to express the null hypothesis used in this test ing : X1 = XE. [_] d) The evidence against the null hypothesis is statistically significant at the 5% significance level
Step by Step Solution
There are 3 Steps involved in it
Step: 1
Get Instant Access to Expert-Tailored Solutions
See step-by-step solutions with expert insights and AI powered tools for academic success
Step: 2
Step: 3
Ace Your Homework with AI
Get the answers you need in no time with our AI-driven, step-by-step assistance