please help me
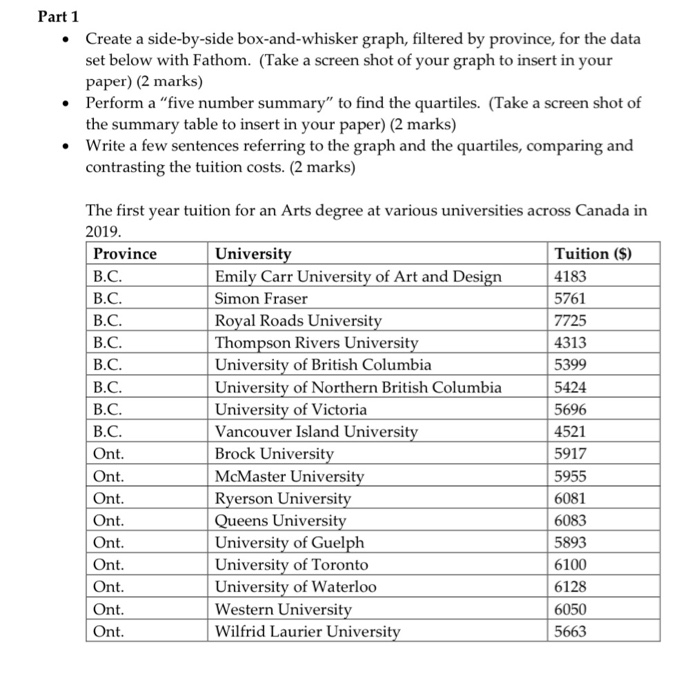
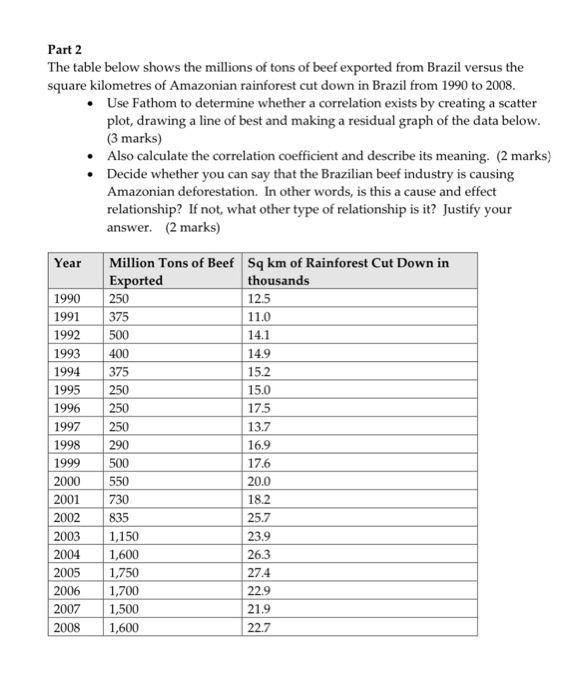
Part 1 Create a side-by-side box-and-whisker graph, filtered by province, for the data set below with Fathom. (Take a screen shot of your graph to insert in your paper) (2 marks) Perform a "five number summary" to find the quartiles. (Take a screen shot of the summary table to insert in your paper) (2 marks) Write a few sentences referring to the graph and the quartiles, comparing and contrasting the tuition costs. (2 marks) The first year tuition for an Arts degree at various universities across Canada in 2019. Province University Tuition ($) B.C. Emily Carr University of Art and Design 4183 B.C. Simon Fraser 5761 B.C. Royal Roads University 7725 B.C. Thompson Rivers University 4313 B.C. University of British Columbia 5399 B.C. University of Northern British Columbia 5424 B.C. University of Victoria 5696 B.C. Vancouver Island University 4521 Ont. Brock University 5917 Ont. McMaster University 5955 Ont. Ryerson University 6081 Ont. Queens University 6083 Ont. University of Guelph 5893 Ont. University of Toronto 6100 Ont. University of Waterloo 6128 Ont. Western University 6050 Ont. Wilfrid Laurier University 5663 Part 2 The table below shows the millions of tons of beef exported from Brazil versus the square kilometres of Amazonian rainforest cut down in Brazil from 1990 to 2008. Use Fathom to determine whether a correlation exists by creating a scatter plot, drawing a line of best and making a residual graph of the data below. (3 marks) Also calculate the correlation coefficient and describe its meaning. (2 marks) Decide whether you can say that the Brazilian beef industry is causing Amazonian deforestation. In other words, is this a cause and effect relationship? If not, what other type of relationship is it? Justify your answer. (2 marks) Year 500 1990 1991 1992 1993 1994 1995 1996 1997 1998 1999 2000 2001 2002 2003 2004 2005 2006 2007 2008 Million Tons of Beef Sq km of Rainforest Cut Down in Exported thousands 250 12.5 375 11.0 14.1 400 14.9 375 15.2 250 15.0 250 17.5 250 13.7 290 16.9 500 17.6 550 20.0 730 18.2 835 25.7 1,150 23.9 1,600 26.3 1,750 27.4 1,700 22.9 1,500 21.9 1,600 22.7 Part 1 Create a side-by-side box-and-whisker graph, filtered by province, for the data set below with Fathom. (Take a screen shot of your graph to insert in your paper) (2 marks) Perform a "five number summary" to find the quartiles. (Take a screen shot of the summary table to insert in your paper) (2 marks) Write a few sentences referring to the graph and the quartiles, comparing and contrasting the tuition costs. (2 marks) The first year tuition for an Arts degree at various universities across Canada in 2019. Province University Tuition ($) B.C. Emily Carr University of Art and Design 4183 B.C. Simon Fraser 5761 B.C. Royal Roads University 7725 B.C. Thompson Rivers University 4313 B.C. University of British Columbia 5399 B.C. University of Northern British Columbia 5424 B.C. University of Victoria 5696 B.C. Vancouver Island University 4521 Ont. Brock University 5917 Ont. McMaster University 5955 Ont. Ryerson University 6081 Ont. Queens University 6083 Ont. University of Guelph 5893 Ont. University of Toronto 6100 Ont. University of Waterloo 6128 Ont. Western University 6050 Ont. Wilfrid Laurier University 5663 Part 2 The table below shows the millions of tons of beef exported from Brazil versus the square kilometres of Amazonian rainforest cut down in Brazil from 1990 to 2008. Use Fathom to determine whether a correlation exists by creating a scatter plot, drawing a line of best and making a residual graph of the data below. (3 marks) Also calculate the correlation coefficient and describe its meaning. (2 marks) Decide whether you can say that the Brazilian beef industry is causing Amazonian deforestation. In other words, is this a cause and effect relationship? If not, what other type of relationship is it? Justify your answer. (2 marks) Year 500 1990 1991 1992 1993 1994 1995 1996 1997 1998 1999 2000 2001 2002 2003 2004 2005 2006 2007 2008 Million Tons of Beef Sq km of Rainforest Cut Down in Exported thousands 250 12.5 375 11.0 14.1 400 14.9 375 15.2 250 15.0 250 17.5 250 13.7 290 16.9 500 17.6 550 20.0 730 18.2 835 25.7 1,150 23.9 1,600 26.3 1,750 27.4 1,700 22.9 1,500 21.9 1,600 22.7