PLEASE help me show excel formula
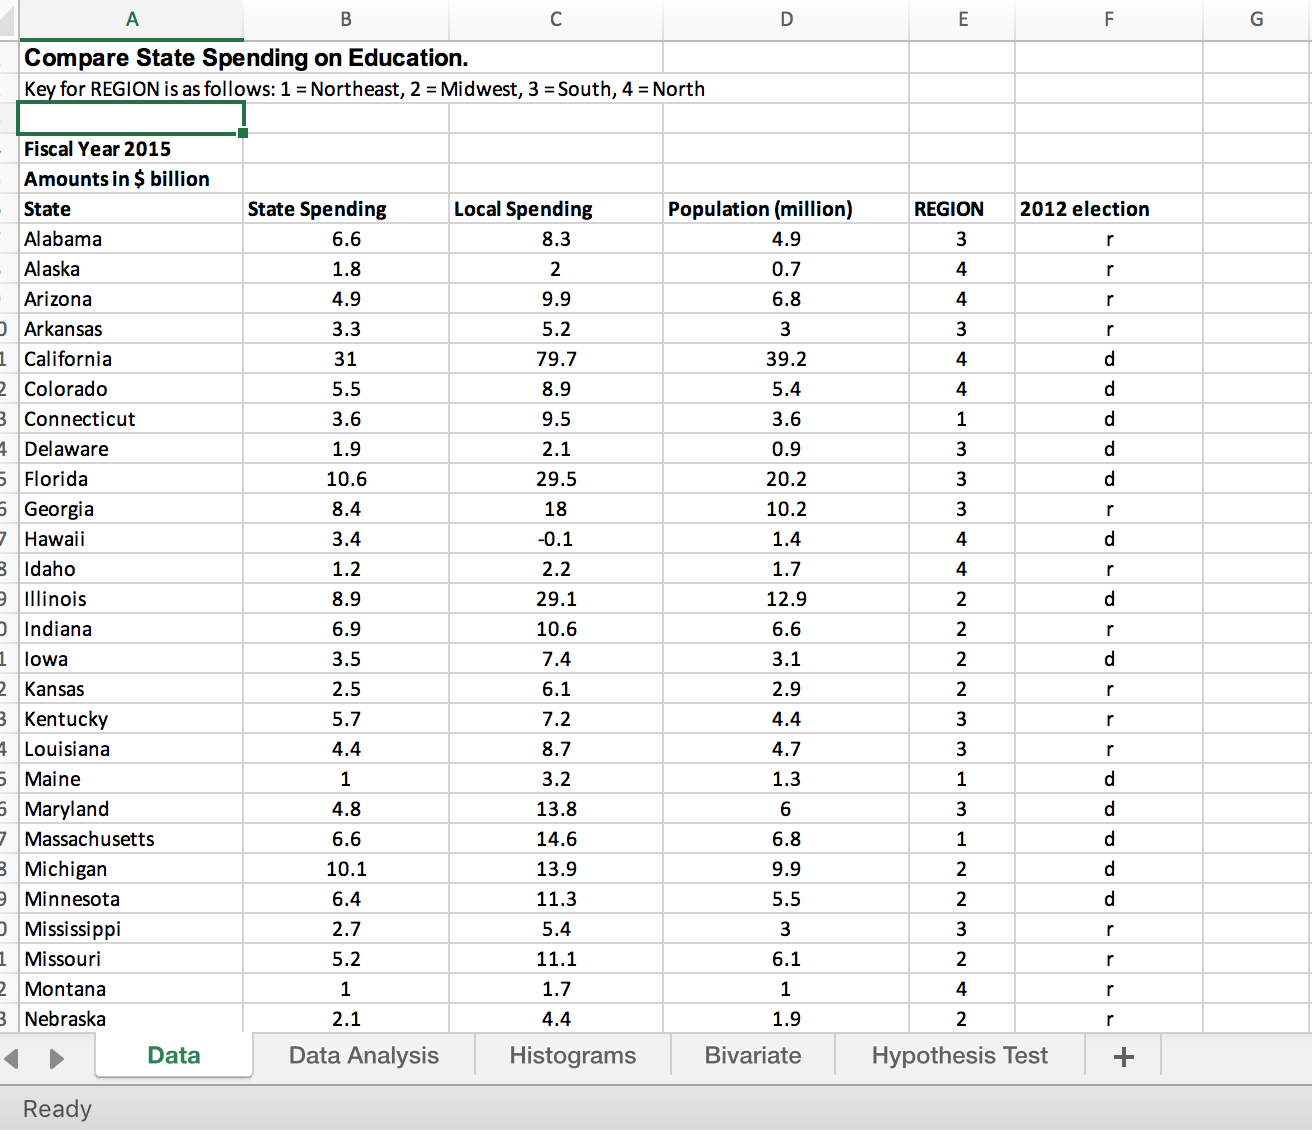
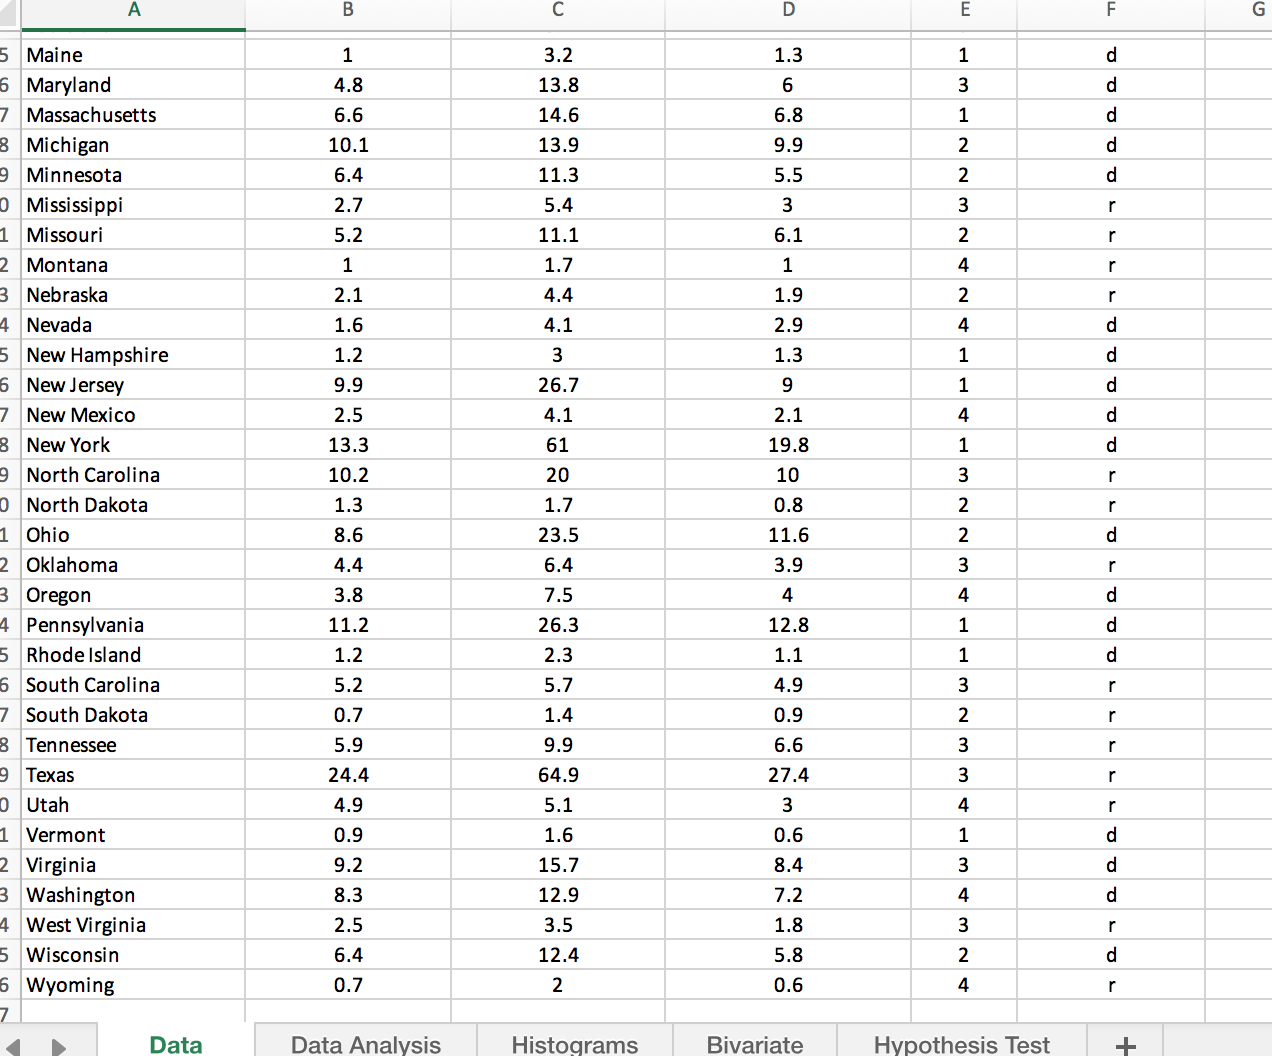
A B C D E F G Compare State Spending on Education. Key for REGION is as follows: 1 = Northeast, 2 = Midwest, 3 = South, 4 = North Fiscal Year 2015 Amounts in $ billion State State Spending Local Spending Population (million) REGION 2012 election Alabama 6.6 8.3 4.9 3 Alaska 1.8 2 0.7 Arizona 4.9 9.9 6.8 Arkansas 3.3 5.2 California 31 79.7 39.2 Colorado 5.5 8.9 5.4 Connecticut 3.6 9.5 3.6 Delaware 1.9 2.1 0.9 Florida 10.6 29.5 20.2 Georgia 8.4 18 10.2 Hawaii 3.4 -0.1 1.4 Idaho 1.2 2.2 1.7 Illinois 8.9 29.1 12.9 Indiana 6.9 10.6 6.6 lowa 3.5 7.4 3.1 Kansas 2.5 6.1 2.9 Kentucky 5.7 7.2 NANWNNH WHWW NN NNAD WWWH 4.4 Louisiana 4.4 8.7 4.7 Maine 1 3.2 1.3 Maryland 4.8 13.8 6 Massachusetts 6.6 14.6 6.8 Michigan 10.1 13.9 9.9 Minnesota 6.4 11.3 5.5 Mississippi 2.7 5.4 3 Missouri 5.2 11.1 6.1 Montana 1 1.7 1 Nebraska 2.1 4.4 1.9 Data Data Analysis Histograms Bivariate Hypothesis Test + ReadyA B C D m TI Maine 1 3.2 1.3 Maryland 4.8 13.8 6 Massachusetts 6.6 14.6 6.8 Michigan 10.1 13.9 9.9 Minnesota 6.4 11.3 5.5 Mississippi 2.7 5.4 3 Missouri 5.2 11.1 6.1 Montana 1 1.7 1 Nebraska 2.1 4.4 1.9 Nevada 1.6 4.1 2.9 New Hampshire 1.2 3 1.3 New Jersey 9.9 26.7 9 New Mexico 2.5 4.1 2.1 New York 13.3 61 19.8 North Carolina 10.2 20 10 North Dakota 1.3 1.7 0.8 A N W A W H A W W N W H H A W N N W H A H H A NA N W N NA WP Ohio 8.6 23.5 11.6 Oklahoma 4.4 6.4 3.9 Oregon 3.8 7.5 4 Pennsylvania 11.2 26.3 12.8 Rhode Island 1.2 2.3 1.1 South Carolina 5.2 5.7 4.9 South Dakota 0.7 1.4 0.9 Tennessee 5.9 9.9 6.6 Texas 24.4 64.9 27.4 Utah 1.9 5.1 3 Vermont 0.9 1.6 0.6 Virginia 9.2 15.7 8.4 Washington 8.3 12.9 7.2 West Virginia 2.5 3.5 1.8 Wisconsin 6.4 12.4 5.8 Wyoming 0.7 2 0.6 Data Data Analysis Histograms Bivariate Hypothesis Test +Question 5 (5 points): Produce a column to the right which eliminates any outliers. Make sure your column is sorted as well. Question 6 (10 points): Complete the following table by creating 8 bins and classifying the data accordingly: Spending Frequency Question 7 (10 point its): Create a relative frequency histogram from the above data . Be sure to label your chart with meaningful axis titles and a chart title. Place your histogram below (not to the side to the problem)A B C D E F G H J K Question 8 (10 points): Create a scatter plot (below) to explore the relationship between state and local spending on education. Make local spending the dependent variable. Make sure you give your scatter plot a clear title and axis labels. 4 00 10 11 12 13 14 15 16 18 19 20 21 22 23 Question 9 (10 points): 24 Using EXCEL calculate the slope and intercept and give the resulting regression equation. 25 26 slope 27 intercept 28 regression line 29 30A B C D E F G H K 21 22 23 Question 9 (10 points): 24 Using EXCEL calculate the slope and intercept and give the resulting regression equation. 25 26 slope 27 intercept 28 regression line 29 30 31 32 Question 10 (10 points): 33 A regression line can be created for any two variables. Doing a correlation 34 describes whether or not there is a meaningful relationship. 35 36 Using an EXCEL function describe the correlation between the two. 37 38 39 Is this a strong or weak correlation? 40 41 42 43 Question 11 (10 points): 44 45 Based on your regression line from question 10, what amount would you predict for local spending if a state spends 46 $40 billion. 47 48 49 What might be some reasons that using that prediction would give you hesitation? 50 51Question 12 (15 points): W N Before the housing market collapsed and the tech bubble imploded the average state spending per pupil was $3500. Does it differ in today's economy? 6 Use the data column you created to answer the question using a hypothesis test. Make your decision using an alpha of .05. 10 Null Hypothesis 11 12 Alternate Hypothesis 13 14 Z (be sure and show calculations) 15 16 17 18 19 Rejection Region 20 21 Conclusion 22 23 24 25 26 Question 13 (5 points): 27 $ 28 29 30