

Answered step by step
Verified Expert Solution
Question
1 Approved Answer
Please help me solve step 6 using excel for the graph and step 5. Thanks Name Project: Linear Modeling (PQL) Mat 115:Prof. Rudy Meangru Project
Please help me solve step 6 using excel for the graph and step 5. Thanks
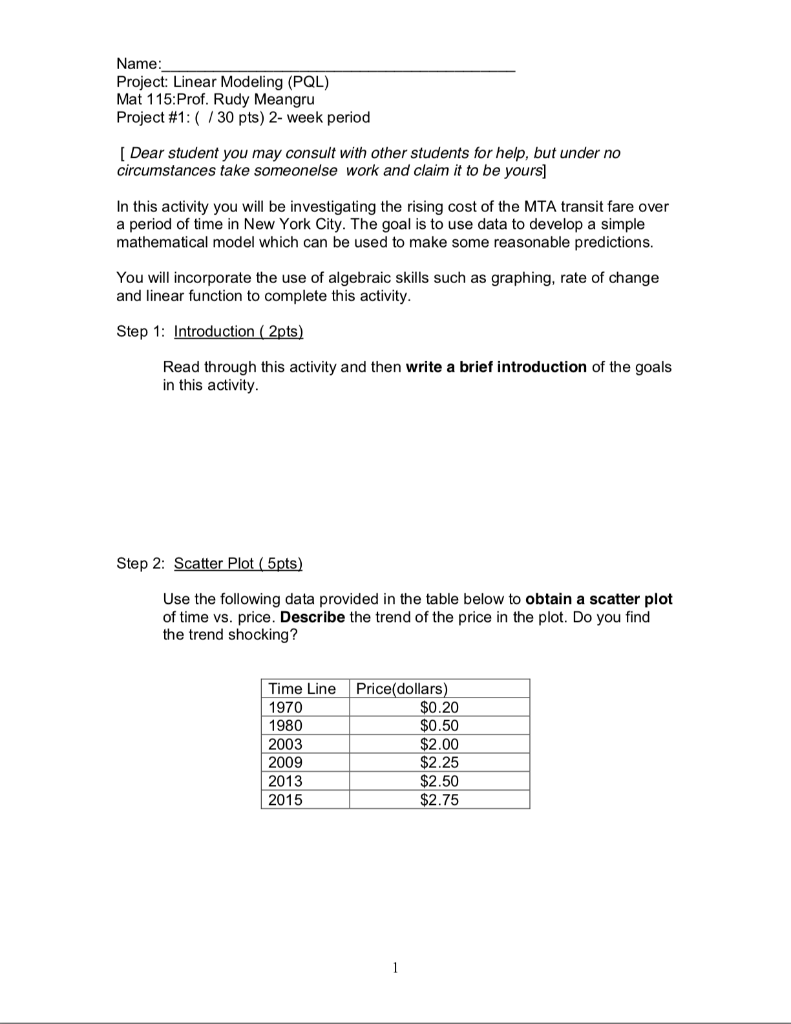
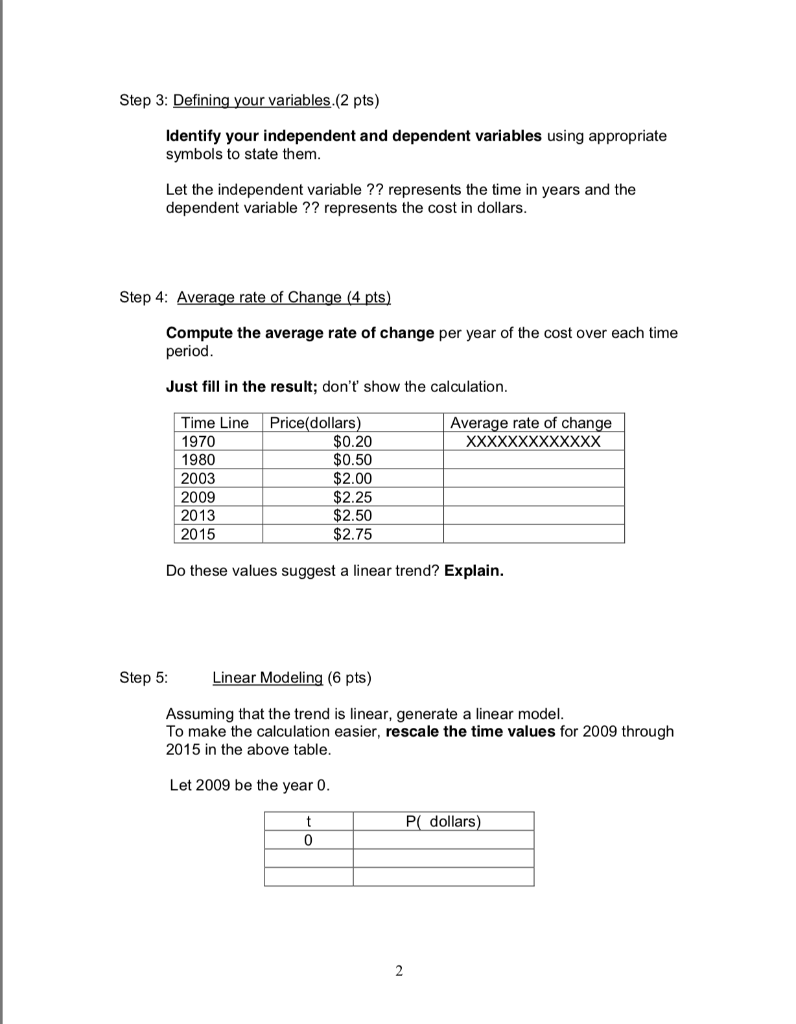
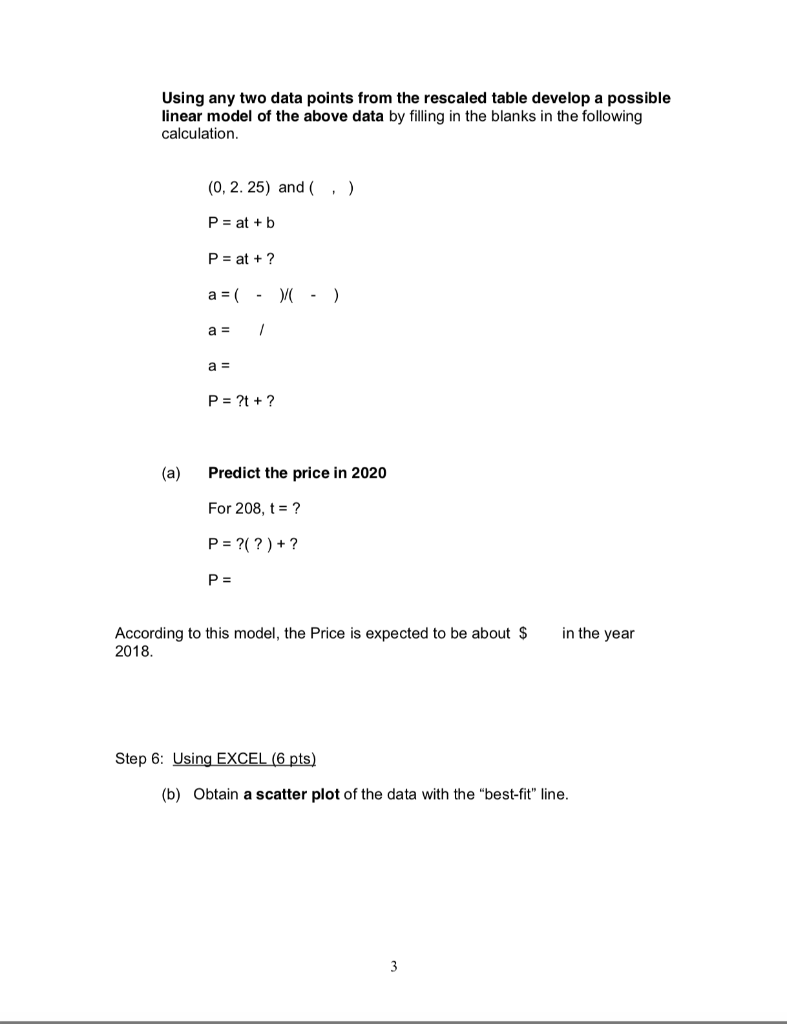
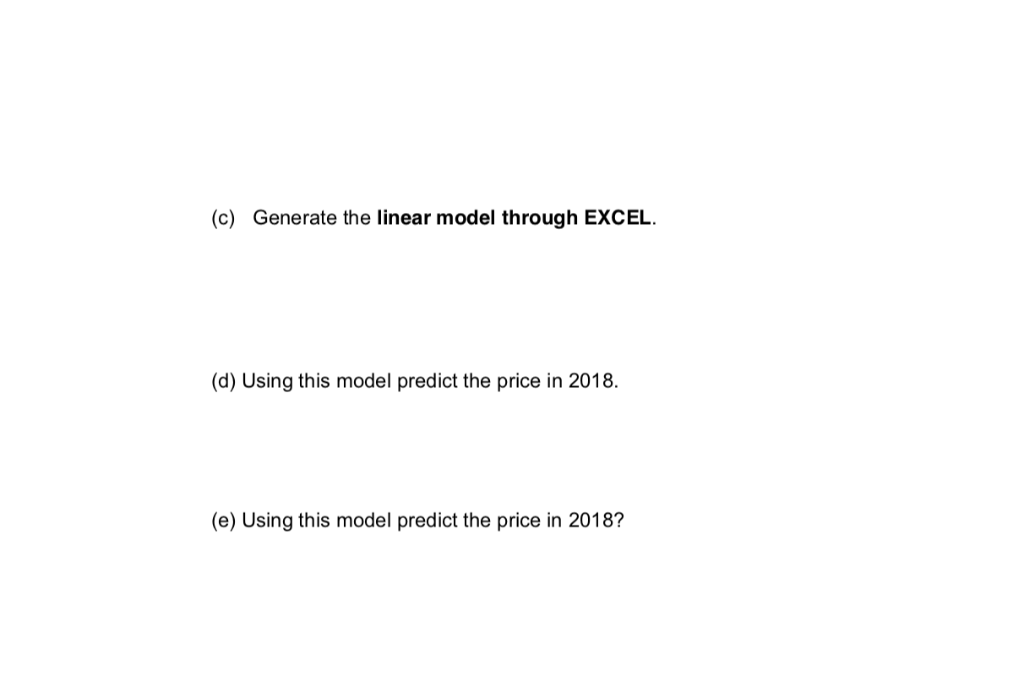
Name Project: Linear Modeling (PQL) Mat 115:Prof. Rudy Meangru Project #1 : ( / 30 pts) 2-week period Dear student you may consult with other students for help, but under no circumstances take someonelse work and claim it to be yours] In this activity you will be investigating the rising cost of the MTA transit fare over a period of time in New York City. The goal is to use data to develop a simple mathematical model which can be used to make some reasonable predictions You will incorporate the use of algebraic skills such as graphing, rate of change and linear function to complete this activity Read through this activity and then write a brief introduction of the goals in this activity Step 2: Scatter Plot (5pts) Use the following data provided in the table below to obtain a scatter plot of time vs. price. Describe the trend of the price in the plot. Do you find the trend shocking? Time Line Price(dollars 1970 1980 2003 2009 2013 2015 $0.20 $0.50 $2.00 $2.25 $2.50 $2.75 ldentify your independent and dependent variables using appropriate symbols to state them Let the independent variable ?? represents the time in years and the dependent variable ?? represents the cost in dollars Compute the average rate of change per year of the cost over each time period Just fill in the result; don't show the calculation Time Line Price(dollars 1970 1980 Average rate of change $0.20 $0.50 $2.00 $2.25 $2.50 2.75 2003 2009 2013 2015 Do these values suggest a linear trend? Explain Step 5: ir Modeling (6 pts) Assuming that the trend is linear, generate a linear model To make the calculation easier, rescale the time values for 2009 through 2015 in the above table Let 2009 be the year 0 P( dollars Using any two data points from the rescaled table develop a possible linear model of the above data by filling in the blanks in the following calculation (0, 2. 25) and (, ) P- at+ a- (a) Predict the price in 2020 For 208, t-? P 2(?)+ According to this model, the Price is expected to be about S 2018. in the year Step 6: Using EXCEL (6 pts) b) Obtain a scatter plot of the data with the "best-fit" line. (c) Generate the linear model through EXCEL (d) Using this model predict the price in 2018. (e) Using this model predict the price in 2018? Name Project: Linear Modeling (PQL) Mat 115:Prof. Rudy Meangru Project #1 : ( / 30 pts) 2-week period Dear student you may consult with other students for help, but under no circumstances take someonelse work and claim it to be yours] In this activity you will be investigating the rising cost of the MTA transit fare over a period of time in New York City. The goal is to use data to develop a simple mathematical model which can be used to make some reasonable predictions You will incorporate the use of algebraic skills such as graphing, rate of change and linear function to complete this activity Read through this activity and then write a brief introduction of the goals in this activity Step 2: Scatter Plot (5pts) Use the following data provided in the table below to obtain a scatter plot of time vs. price. Describe the trend of the price in the plot. Do you find the trend shocking? Time Line Price(dollars 1970 1980 2003 2009 2013 2015 $0.20 $0.50 $2.00 $2.25 $2.50 $2.75 ldentify your independent and dependent variables using appropriate symbols to state them Let the independent variable ?? represents the time in years and the dependent variable ?? represents the cost in dollars Compute the average rate of change per year of the cost over each time period Just fill in the result; don't show the calculation Time Line Price(dollars 1970 1980 Average rate of change $0.20 $0.50 $2.00 $2.25 $2.50 2.75 2003 2009 2013 2015 Do these values suggest a linear trend? Explain Step 5: ir Modeling (6 pts) Assuming that the trend is linear, generate a linear model To make the calculation easier, rescale the time values for 2009 through 2015 in the above table Let 2009 be the year 0 P( dollars Using any two data points from the rescaled table develop a possible linear model of the above data by filling in the blanks in the following calculation (0, 2. 25) and (, ) P- at+ a- (a) Predict the price in 2020 For 208, t-? P 2(?)+ According to this model, the Price is expected to be about S 2018. in the year Step 6: Using EXCEL (6 pts) b) Obtain a scatter plot of the data with the "best-fit" line. (c) Generate the linear model through EXCEL (d) Using this model predict the price in 2018. (e) Using this model predict the price in 2018Step by Step Solution
There are 3 Steps involved in it
Step: 1

Get Instant Access to Expert-Tailored Solutions
See step-by-step solutions with expert insights and AI powered tools for academic success
Step: 2

Step: 3
Ace Your Homework with AI
Get the answers you need in no time with our AI-driven, step-by-step assistance
Get Started
Relational Theory For Computer Professionals What Relational Databases Are Really All About
Authors: C J Date
1st Edition
1449369464, 9781449369460