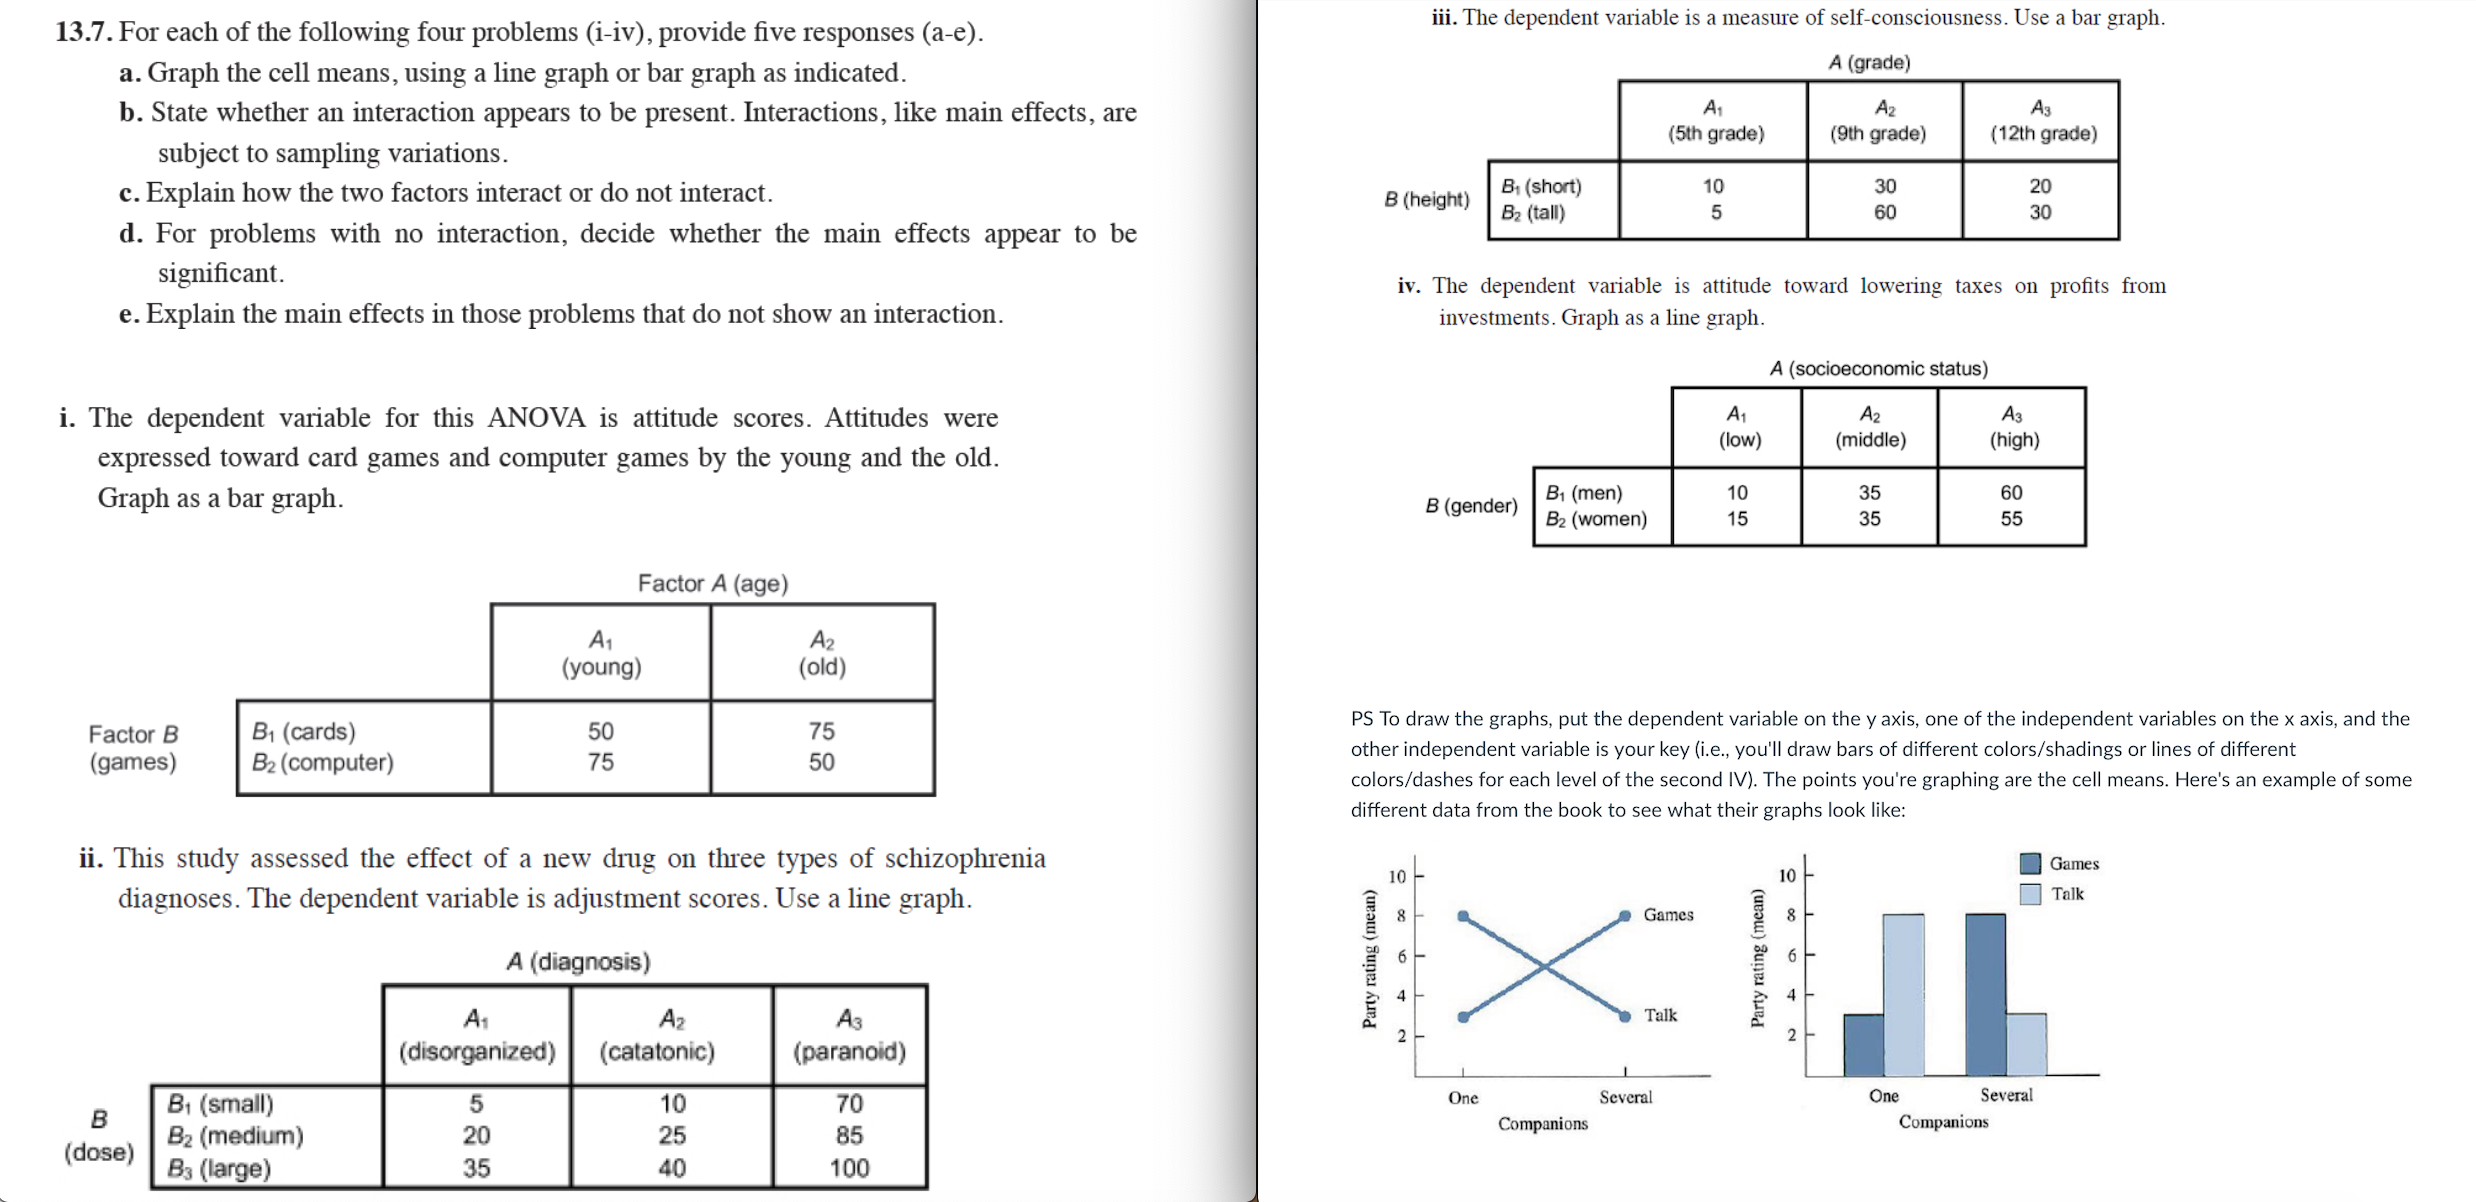
Please help me solve these ! Thank you!
l3.7. For each of the following four problems (i-iv), provide ve responses (ae). a. Graph the cell means, using a line graph or bar graph as indicated. b. State whether an interaction appears to be present. Interactions, like main effects, are subject to sampling variations. c. Explain how the two factors interact or do not interact. d. For problems with no interaction, decide whether the main effects appear to be signicant. e. Explain the main effects in those problems that do not show an interaction. i. The dependent variable for this ANOVA is attitude scores. Attitudes were expressed toward card games and computer games by the young and the old. Graph as a bar graph. Factor A (age) Factor B (games) 81 (cards) so 15 B: (computer) 75 50 ii. This study assessed the effect of a new drug on three types of schizophrenia diagnoses. The dependent variable is adjustment scores. Use a line graph. A (diagnosis) Al A2 A5 (dieorwnlzed) (catatonic) (normal) \" u 70 iii.The dependent variable is a measure of selficonsciousness. Use a bar graph. A (W0) A. A: A: (5h 936) (9"! 9'86!) (12%" 9"\") Br (short) 51 (ll) 30 iv. The dependent variable is attitude toward lowering taxes on prots from investments. Graph as a line graph. 5 (NW) A (socioeconomic status) '1 A2 A: (low) (middle) (high) 5 (W) PS To draw the graphs, put the dependent variable on the yaxis, one of the independent variables on the x axis, and the other independent variable is your key (i.e., you'll draw bars of different colors/shading: or lines of different colors/dashes for each level of the second IV). The points you're graphing are the cell means. Here's an example of some different data from the book to see what their graphs look like: in lo I a" '\" A ~ iruik g 8 Gem g 3 v 6 g a 1'le E a a 1 l n One 3mm Sevuul Crvmplnlnll Cumin