Please help me solve this!!
Financial Statement Analysis
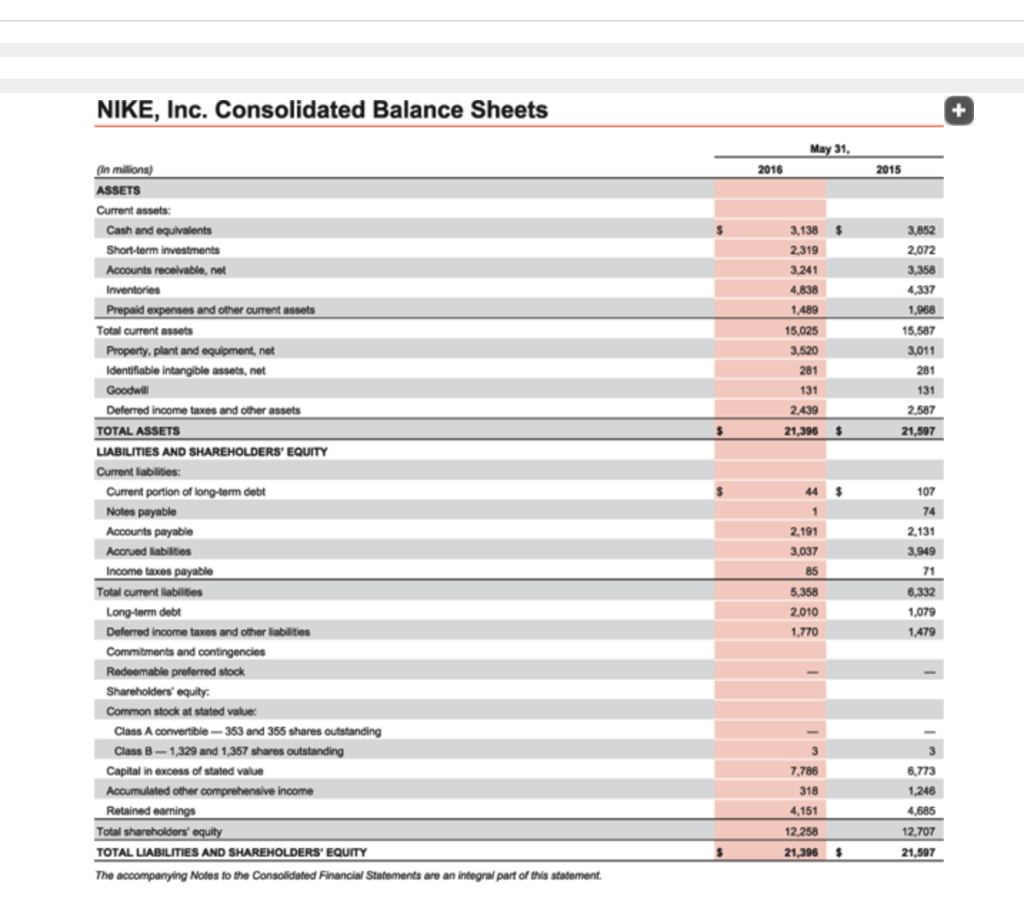
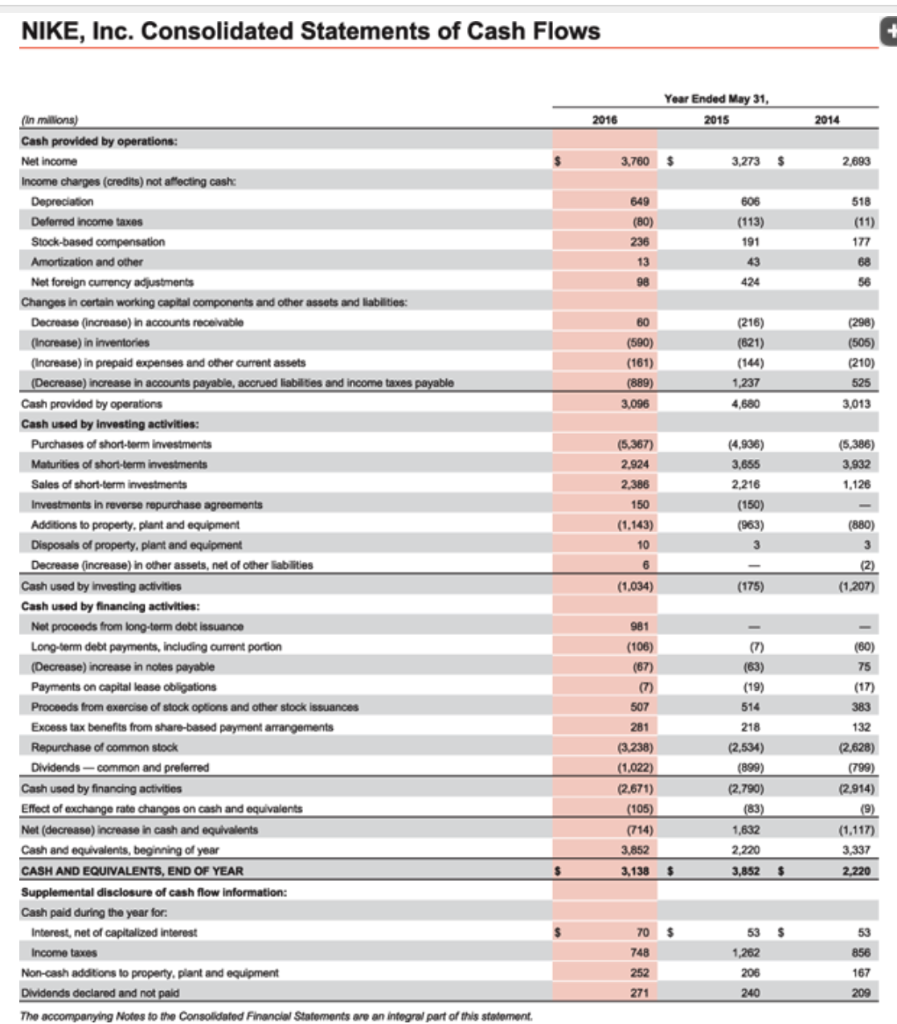
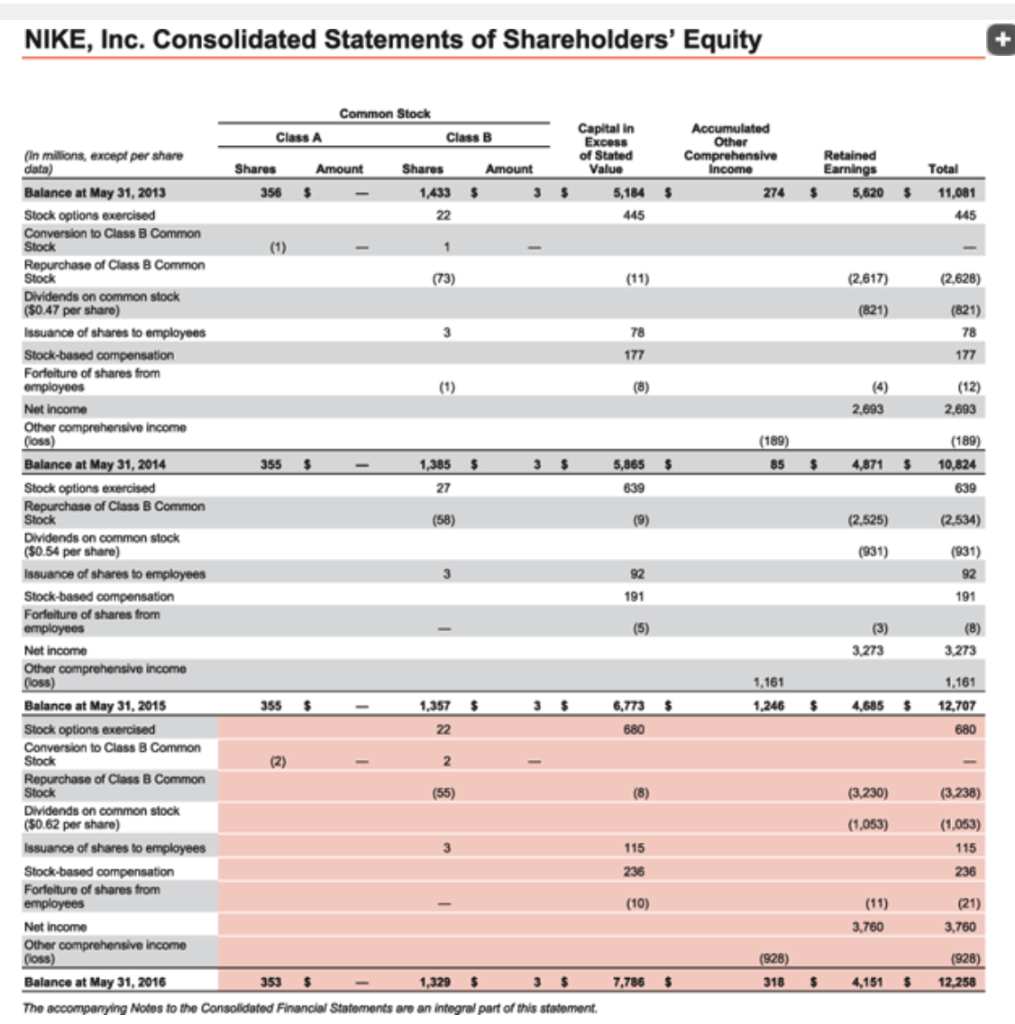
The financial statements for Nike, Inc., are presented in Appendix D . Use the following additional information (in thousands):
Accounts receivable at May 31, 2014: $3,117 Inventories at May 31, 2014: 3,947 Total assets at May 31, 2014: 18,594 Stockholders equity at May 31, 2014: 12,000
1. Determine the following measures for the fiscal years ended May 31, 2016, and May 31, 2015. Do not round interim calculations. Round the working capital amount in part (a) to the nearest dollar. Round all other final answers to one decimal place. When required, use the rounded final answers in subsequent computations.
| | | May 31, 2016 | | May 31, 2015 |
| a. | Working capital (in millions) | $ | | $ | | |
| b. | Current ratio | | | | | |
| c. | Quick ratio | | | | | |
| d. | Accounts receivable turnover | | | | | |
| e. | Number of days' sales in receivables | | days | | days | |
| f. | Inventory turnover | | | | | |
| g. | Number of days' sales in inventory | | days | | days | |
| h. | Ratio of liabilities to stockholders' equity | | | | | |
| i. | Asset turnover | | | | | |
| j. | Return on total assets | | % | | % | |
| k. | Return on common stockholders' equity | | % | | % | |
| l. | Price-earnings ratio, assuming that the market price was $54.90 per share on May 29, 2016, and $52.81 per share on May 30, 2015. | | | | | |
| m. | Percentage relationship of net income to sales | | % | | % | |
2. The working capital decreased between 2015 and 2016. The current and quick ratios both decreased during 2016. The accounts receivable turnover decreased and number of days sales in receivables decreased slightly. The margin of protection to creditors decreased . The return on total assets increased during 2016. The return on common stockholders equity remained constant .The percent of net income to sales increased during 2016.
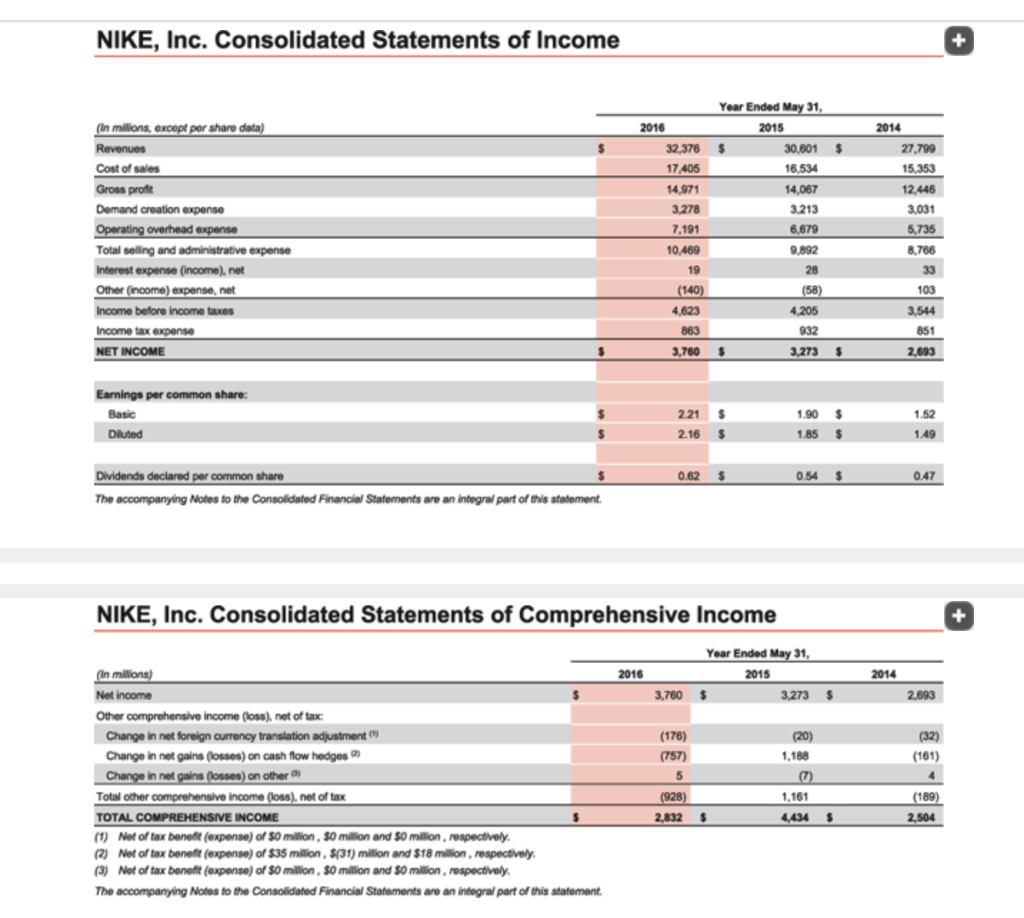
NIKE, Inc. Consolidated Statements of Income + (In millions, except per share data) Revenues Cost of sales Gross profit Demand creation expense Operating overhead expense Total selling and administrative expense Interest expense (income), net Other (income) expense, net Income before income taxes Income tax expense NET INCOME Year Ended May 31, 2016 2015 32,378 $ 30,601 $ 17.405 16,534 14.971 14,067 3.278 3.213 7,191 6,679 10.469 9,892 19 28 (140) (58) 4,623 4.205 863 932 3,760 5 3,2735 2014 27.799 15,353 12.446 3,031 5.735 8.786 33 103 3,544 851 2,693 $ Earnings per common share: Basic Diluted $ 1.90 $ 1.52 2.21 $ 2.18 $ $ 1.85 1.49 0.625 0.54 $ 0.47 Dividends declared per common share $ The accompanying Notes to the Consolidated Financial Statements are an integral part of this statement NIKE, Inc. Consolidated Statements of Comprehensive Income + 2016 Year Ended May 31, 2015 3,760 $ 3,273 $ 2014 2,693 (20) 1,188 (32) (161) (In millions) Net income Other comprehensive income (loss), net of tax Change in net foreign currency translation adjustment Change in net gains (losses) on cash flow hedges Change in net gains (losses) on other Total other comprehensive income (oss), net of tax TOTAL COMPREHENSIVE INCOME (1) Net of tax beneft (expense) of $0 million, 50 million and S0 million, respectively. (2) Net of tax benefit (expense) of $35 million, S(31) million and $18 million, respectively. (3) Net of tax benefit (exponse) of 50 million, 50 million and S0 million, respectively. The accompanying Notes to the Consolidated Financial Statements are an integral part of this statement (178) (757) 5 (928) 2,832 4 1,161 4,4345 (189) 2,504 $ NIKE, Inc. Consolidated Balance Sheets + May 31, 2016 2015 3.138 $ 2,319 3.241 4,838 1.489 15.025 3.520 281 3,852 2,072 3,358 4,337 1,968 15.587 3,011 281 131 2,587 131 2,439 21,396 $ 21,597 44 $ 107 (In millions) ASSETS Current assets: Cash and equivalents Short-term investments Accounts receivable, net Inventories Prepaid expenses and other current assets Total current assets Property, plant and equipment, net Identifiable intangible assets, net Goodwill Deferred income taxes and other assets TOTAL ASSETS LIABILITIES AND SHAREHOLDERS' EQUITY Current liabilities: Current portion of long-term debt Notes payable Accounts payable Accrued kabilities Income taxes payable Total current liabilities Long-term debt Deferred income taxes and other liabilities Commitments and contingencies Redeemable preferred stock Shareholders' equity: Common stock at stated value: Class A convertible - 353 and 356 shares outstanding Class B - 1,329 and 1,357 shares outstanding Capital in excess of stated value Accumulated other comprehensive income Retained earnings Total shareholders' equity TOTAL LIABILITIES AND SHAREHOLDERS' EQUITY The accompanying Notes to the Consolidated Financial Statements are an integral part of this statement. 74 2,131 3,949 1 2,191 3,037 85 5.358 2,010 1,770 71 6.332 1,079 1,479 3 7.786 318 4,151 12258 21,396 6.773 1.246 4,685 12,707 21,597 $ NIKE, Inc. Consolidated Statements of Cash Flows Year Ended May 31, 2015 2016 2014 3.760 $ 3.273 $ 2,693 649 (80) 236 606 (113) 191 43 424 518 (11) 177 13 68 98 56 60 (590) (216) (821) (144) 1,237 4,680 (298) (505) (210) 525 (161) (889) 3.096 3,013 (4,936) 3,655 (5.367) 2.924 2,386 150 (5,386) 3.932 1,126 2.216 (150) (963) (1,143) (in Millions) Cash provided by operations: Net income Income charges (credits) not affecting cash Depreciation Deferred Income taxes Stock-based compensation Amortization and other Net foreign currency adjustments Changes in certain working capital components and other assets and liabilities: Decrease increase) in accounts receivable (Increase) in inventories (Increase) in prepaid expenses and other current assets (Decrease) increase in accounts payable, accrued liabilities and income taxes payable Cash provided by operations Cash used by investing activities: Purchases of short-term investments Maturities of short-term investments Sales of short-term investments Investments in reverse repurchase agreements Additions to property, plant and equipment Disposals of property, plant and equipment Decrease increase) in other assets, net of other liabilities Cash used by investing activities Cash used by financing activities: Net proceeds from long-term debt issuance Long-term debt payments, including current portion (Decrease) increase in notes payable Payments on capital lease obligations Proceeds from exercise of stock options and other stock issuances Excess tax benefits from share-based payment arrangements Repurchase of common stock Dividends - common and preferred Cash used by financing activities Effect of exchange rate changes on cash and equivalents Net (decrease) increase in cash and equivalents Cash and equivalents, beginning of year CASH AND EQUIVALENTS, END OF YEAR Supplemental disclosure of cash flow information: Cash paid during the year for: Interest, net of capitalized interest Income taxes Non-cash additions to property, plant and equipment Dividends declared and not paid The accompanying Notos to the Consolidated Financial Statements are an integral part of this statement 10 6 (880) 3 (2) (1.207) (1.034) (175) 981 (60) (106) (67) (7) 75 507 383 132 (2,628) 281 (3.238) (1,022) (2.671) (105) (714) 3.852 3.138 (63) (19) 514 218 (2,534) (899) (2.790) (83) 1,632 2,220 3,852 (799) (2.914) (9) (1,117) 3.337 $ $ 2.220 53 $ 1.262 70 $ 748 252 271 53 856 167 206 240 209 NIKE, Inc. Consolidated Statements of Shareholders' Equity + Accumulated Other Comprehensive Retained Income Earnings 274 $ 5,620 $ Total 11,081 445 (2.617) (2.628) (821) (821) 78 177 (12) 2,693 2,693 (189) (189) 10,824 85 $ 4.871 $ 639 (2.525) (2.534) (931) Common Stock Capital in Class A Class B Excess (in Millions, except per share of Stated data) Shares Amount Shares Amount Value Balance at May 31, 2013 356 $ 1,433 $ 5,184 $ Stock options exercised 22 445 Conversion to Class B Common Stock (1) 1 Repurchase of Class B Common Stock (73) Dividends on common stock ($0.47 per share) Issuance of shares to employees 3 78 Stock-based compensation 177 Forfeiture of shares from employees (8) Net Income Other comprehensive Income (los) Balance at May 31, 2014 355 $ 1,385 5,865 $ Stock options exercised 27 639 Repurchase of Class B Common Stock (58) (9) Dividends on common stock (80.54 per share) Issuance of shares to employees 92 Stock-based compensation 191 Forfeiture of shares from employees (5) Net income Other comprehensive income (loss) Balance at May 31, 2015 355 $ 1,357 $ 6,773 $ Stock options exercised 22 680 Conversion to Class B Common Stock (2) 2 Repurchase of Class B Common Stock (55) (8) Dividends on common stock (50.62 per share) Issuance of shares to employees 115 Stock-based compensation 236 Forfeiture of shares from employees (10) Not Income Other comprehensive income (loss) Balance at May 31, 2016 353 $ 1,329 $ 7,786 $ The accompanying Notos to the Consolidated Financial Statements are an integral part of this statement. (931) 92 191 (3) 3.273 (8) 3.273 1.161 1,161 1.246 $ 4.6855 12,707 680 (3.230) (3.238) (1,053) (1.053) 115 236 (21) 3.760 3.760 (928) (928) 318 $ 4.151 $ 12.258