

Answered step by step
Verified Expert Solution
Question
1 Approved Answer
Please help me The heights of 8 th graders are modeled using the normal distribution shown below. The mean of the distribution is 68.6 in
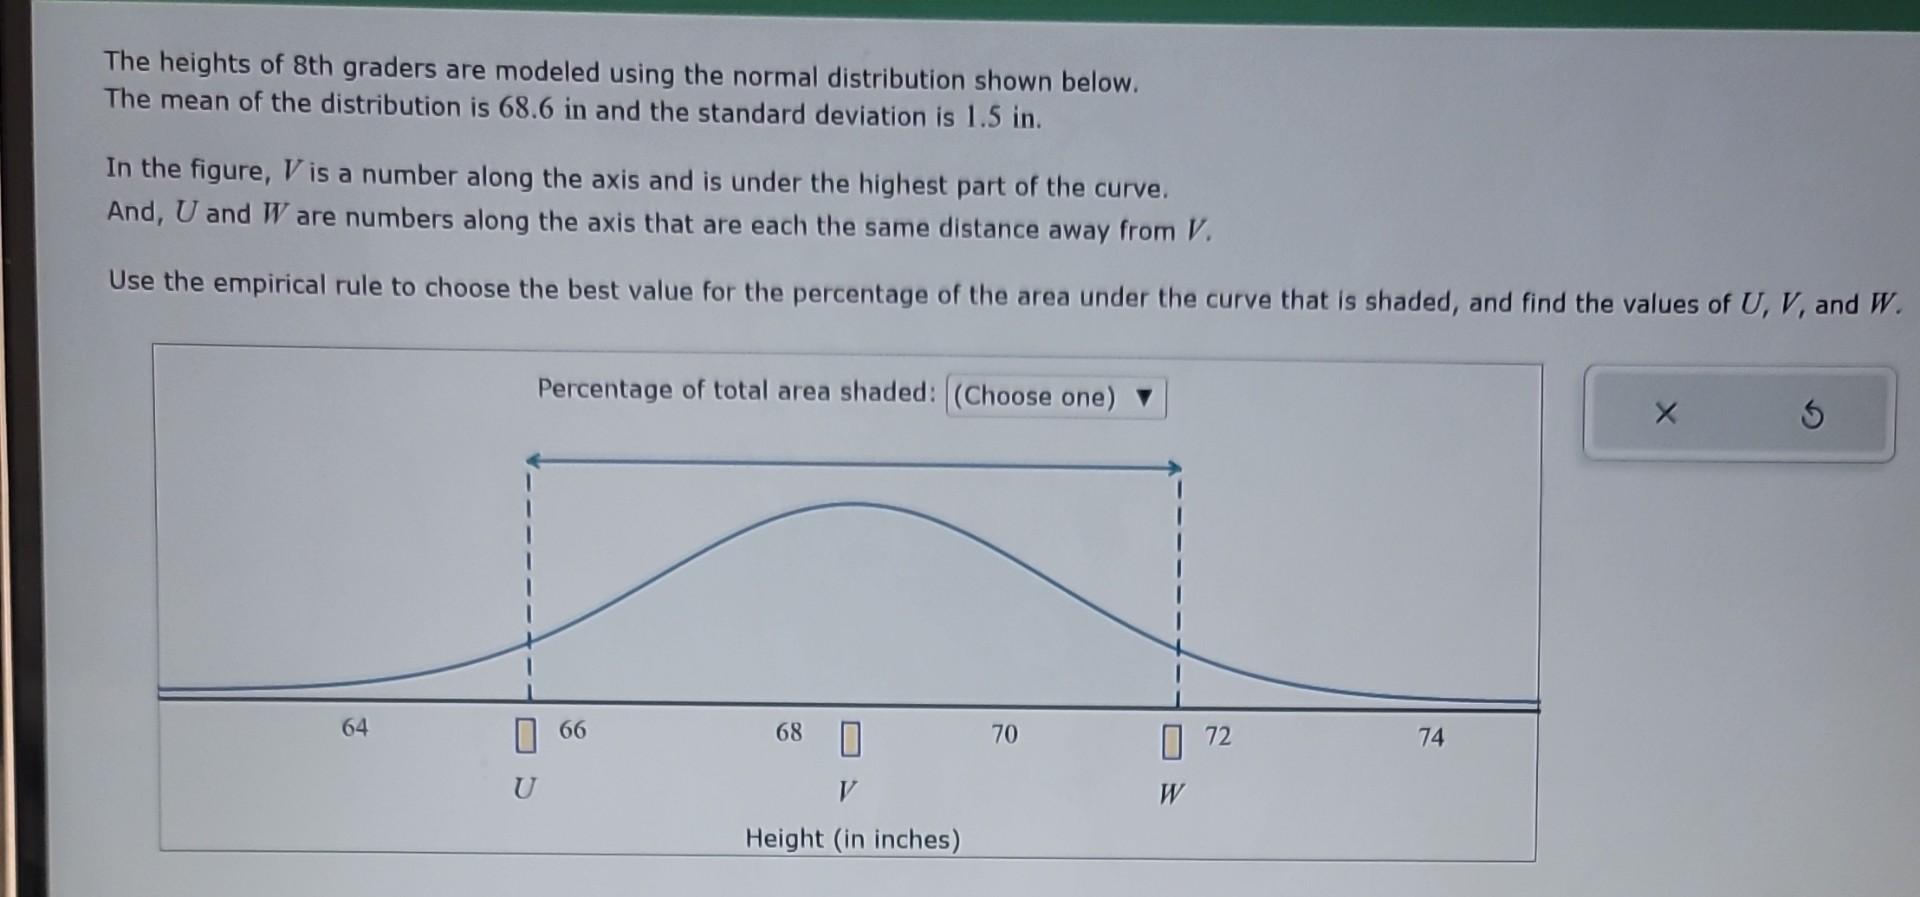
Please help me
The heights of 8 th graders are modeled using the normal distribution shown below. The mean of the distribution is 68.6 in and the standard deviation is 1.5 in. In the figure, V is a number along the axis and is under the highest part of the curve. And, U and W are numbers along the axis that are each the same distance away from V. Use the empirical rule to choose the best value for the percentage of the area under the curve that is shaded, and find the values of U, V, and WStep by Step Solution
There are 3 Steps involved in it
Step: 1

Get Instant Access to Expert-Tailored Solutions
See step-by-step solutions with expert insights and AI powered tools for academic success
Step: 2

Step: 3
Ace Your Homework with AI
Get the answers you need in no time with our AI-driven, step-by-step assistance
Get Started
Numerical Analysis
Authors: Richard L. Burden, J. Douglas Faires
9th edition
538733519, 978-1133169338, 1133169333, 978-0538733519