

Question
Please help me this whole question. Thank you. A cement manufacturing company has a packing plant containing a large number of packing machines. To test
Please help me this whole question. Thank you.
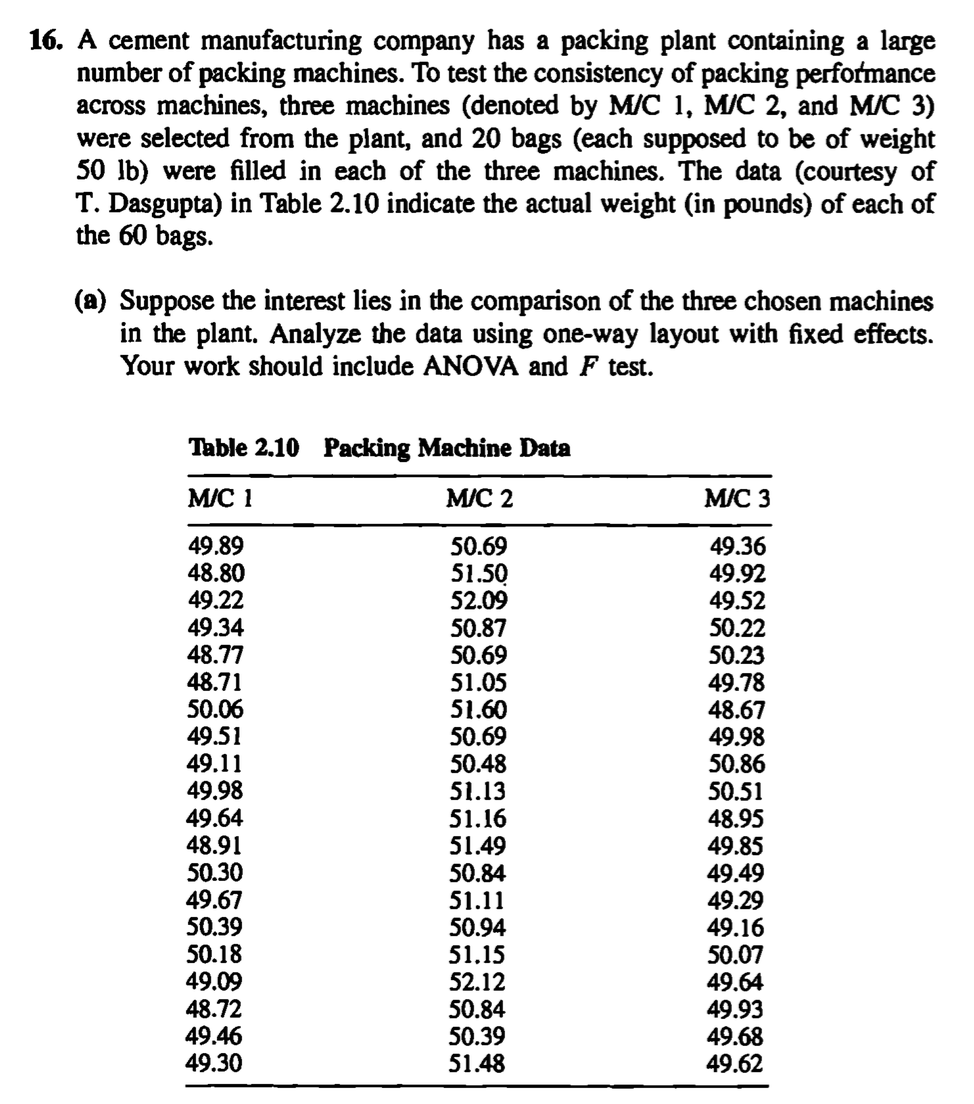
A cement manufacturing company has a packing plant containing a large number of packing machines. To test the consistency of packing perfonnance across machines, three machines (denoted by Mle 1, Mle 2, and Mle 3) were selected from the plant, and 20 bags (each supposed to be of weight 50 lb) were filled in each of the three machines. The data (courtesy of T. Dasgupta) in Table 2.10 indicate the actual weight (in pounds) of each of the 60 bags.
(a) Suppose the interest lies in the comparison of the three chosen machines in the plant. Analyze the data using one-way layout with fixed effects. Your work should include ANOVA and F test.
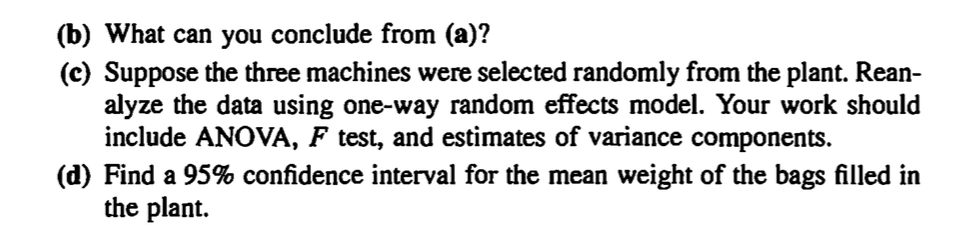
b) What can you conclude from (a)?
(e) Suppose the three machines were selected randomly from the plant. Rean- alyze the data using one-way random effects model. Your work should include ANOYA, F test, and estimates of variance components.
(d) Find a 95% confidence interval for the mean weight of the bags filled in the plant.
1Bble 2.10
MlC 1
49.89 48.80 49.22 49.34 48.77 48.71 50.06 49.51 49.11 49.98 49.64 48.91 50.30 49.67 50.39 50.18 49.09 48.72 49.46 49.30
Packing Machine Data MlC2
50.69 51.5Q 52.09 50.87 50.69 51.05 51.60 50.69 50.48 51.13 51.16 51.49 50.84 51.11 50.94 51.15 52.12 50.84 50.39 51.48
MlC3
49.36 49.92 49.52 50.22 50.23 49.78 48.67 49.98 50.86 50.51 48.95 49.85 49.49 49.29 49.16 50.07 49.64 49.93 49.68
49.62
Step by Step Solution
There are 3 Steps involved in it
Step: 1

Get Instant Access to Expert-Tailored Solutions
See step-by-step solutions with expert insights and AI powered tools for academic success
Step: 2

Step: 3
Ace Your Homework with AI
Get the answers you need in no time with our AI-driven, step-by-step assistance
Get Started
An Introduction to the Mathematics of Financial Derivatives
Authors: Ali Hirsa, Salih N. Neftci
3rd edition
012384682X, 978-0123846822