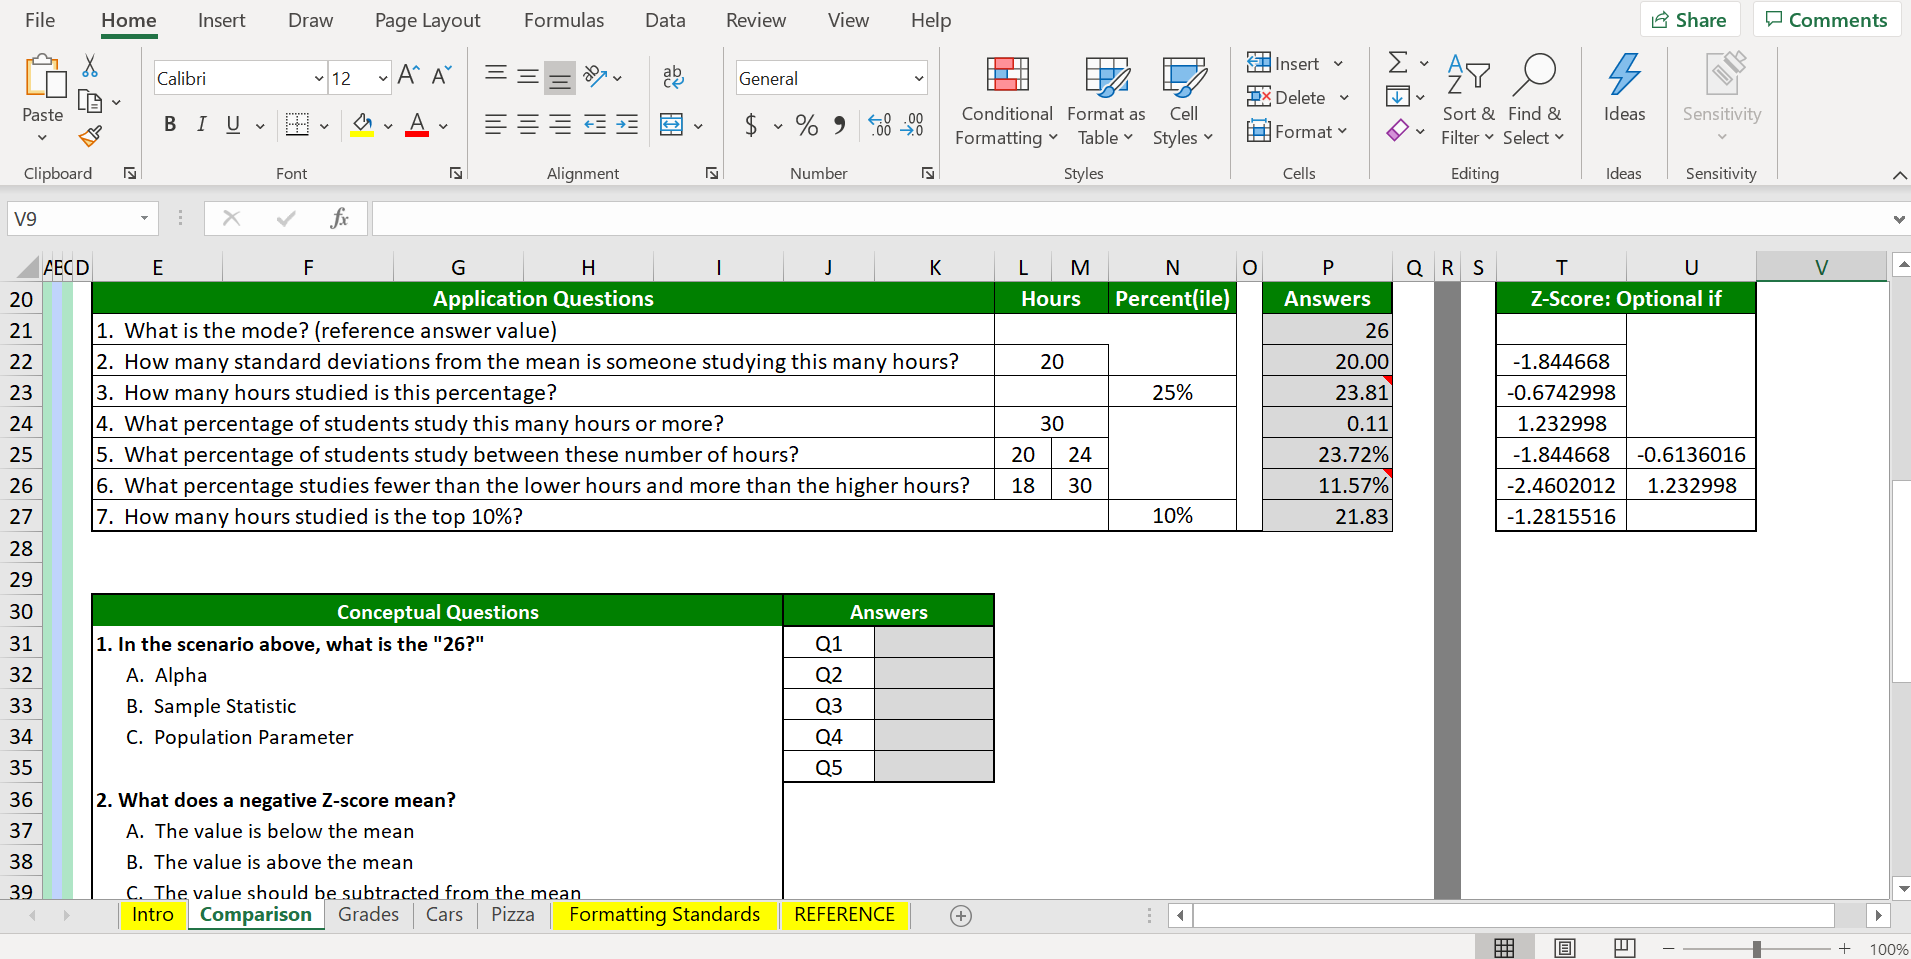
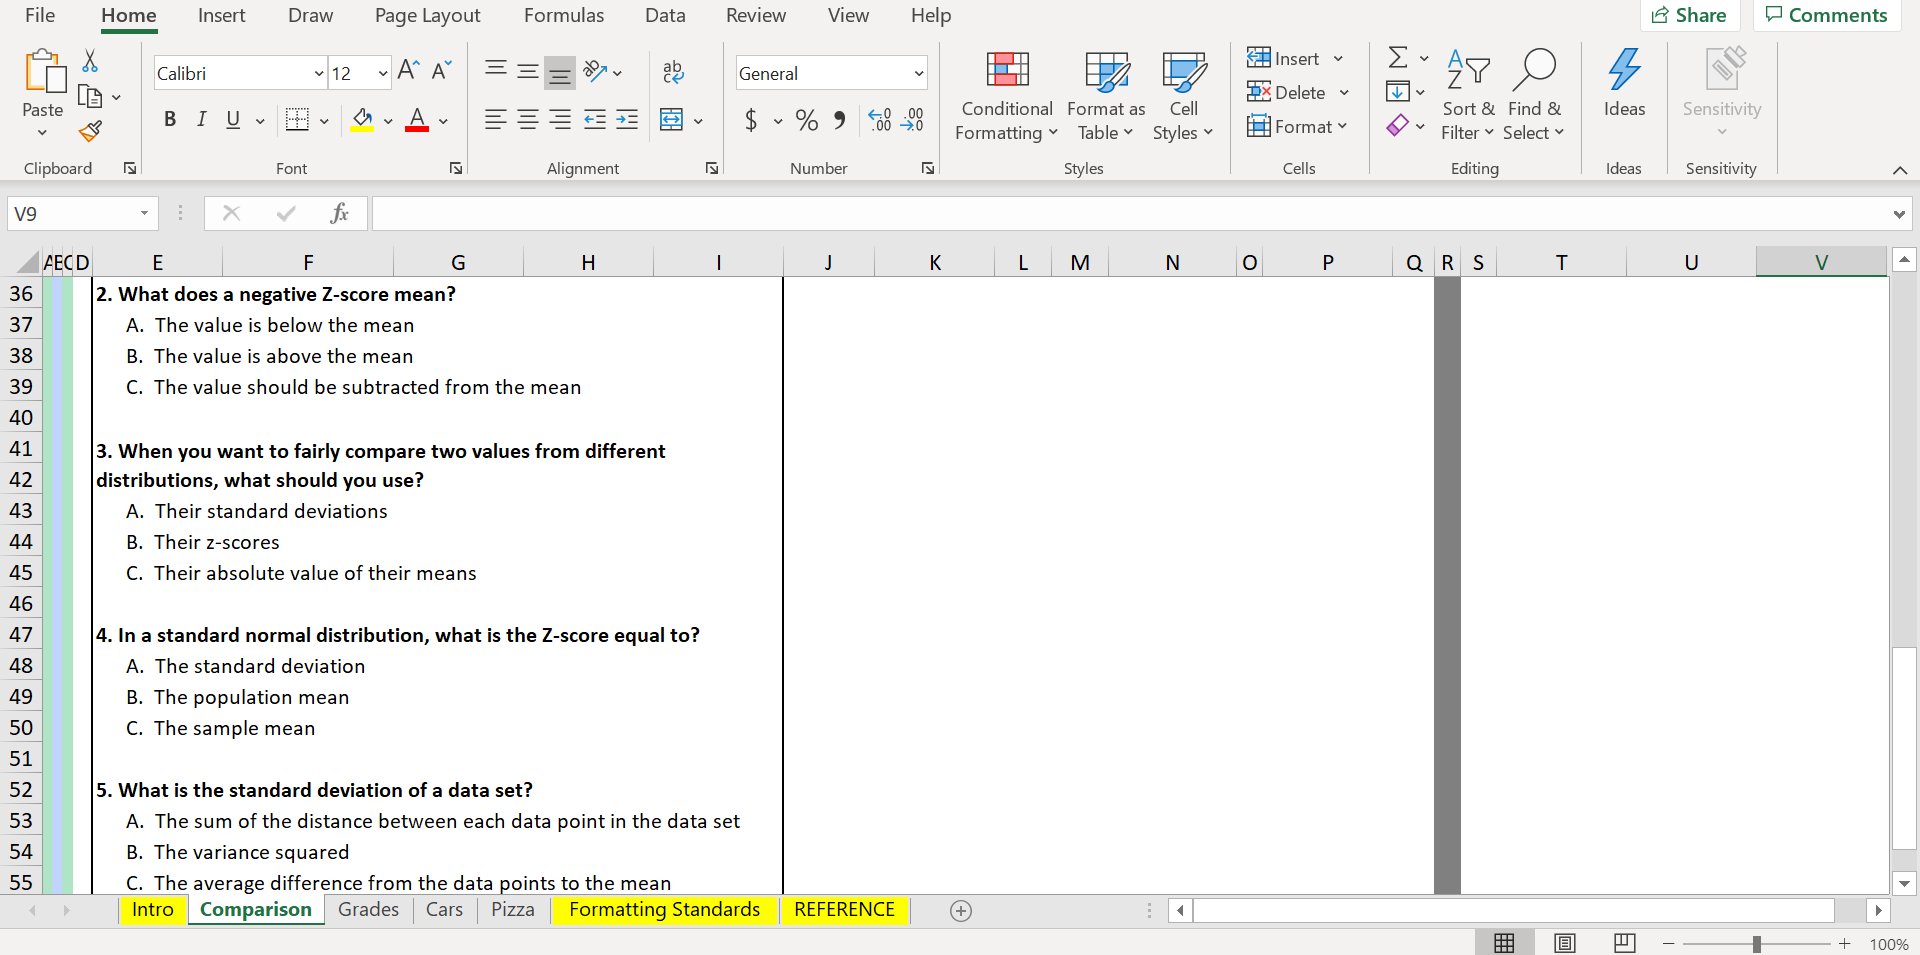
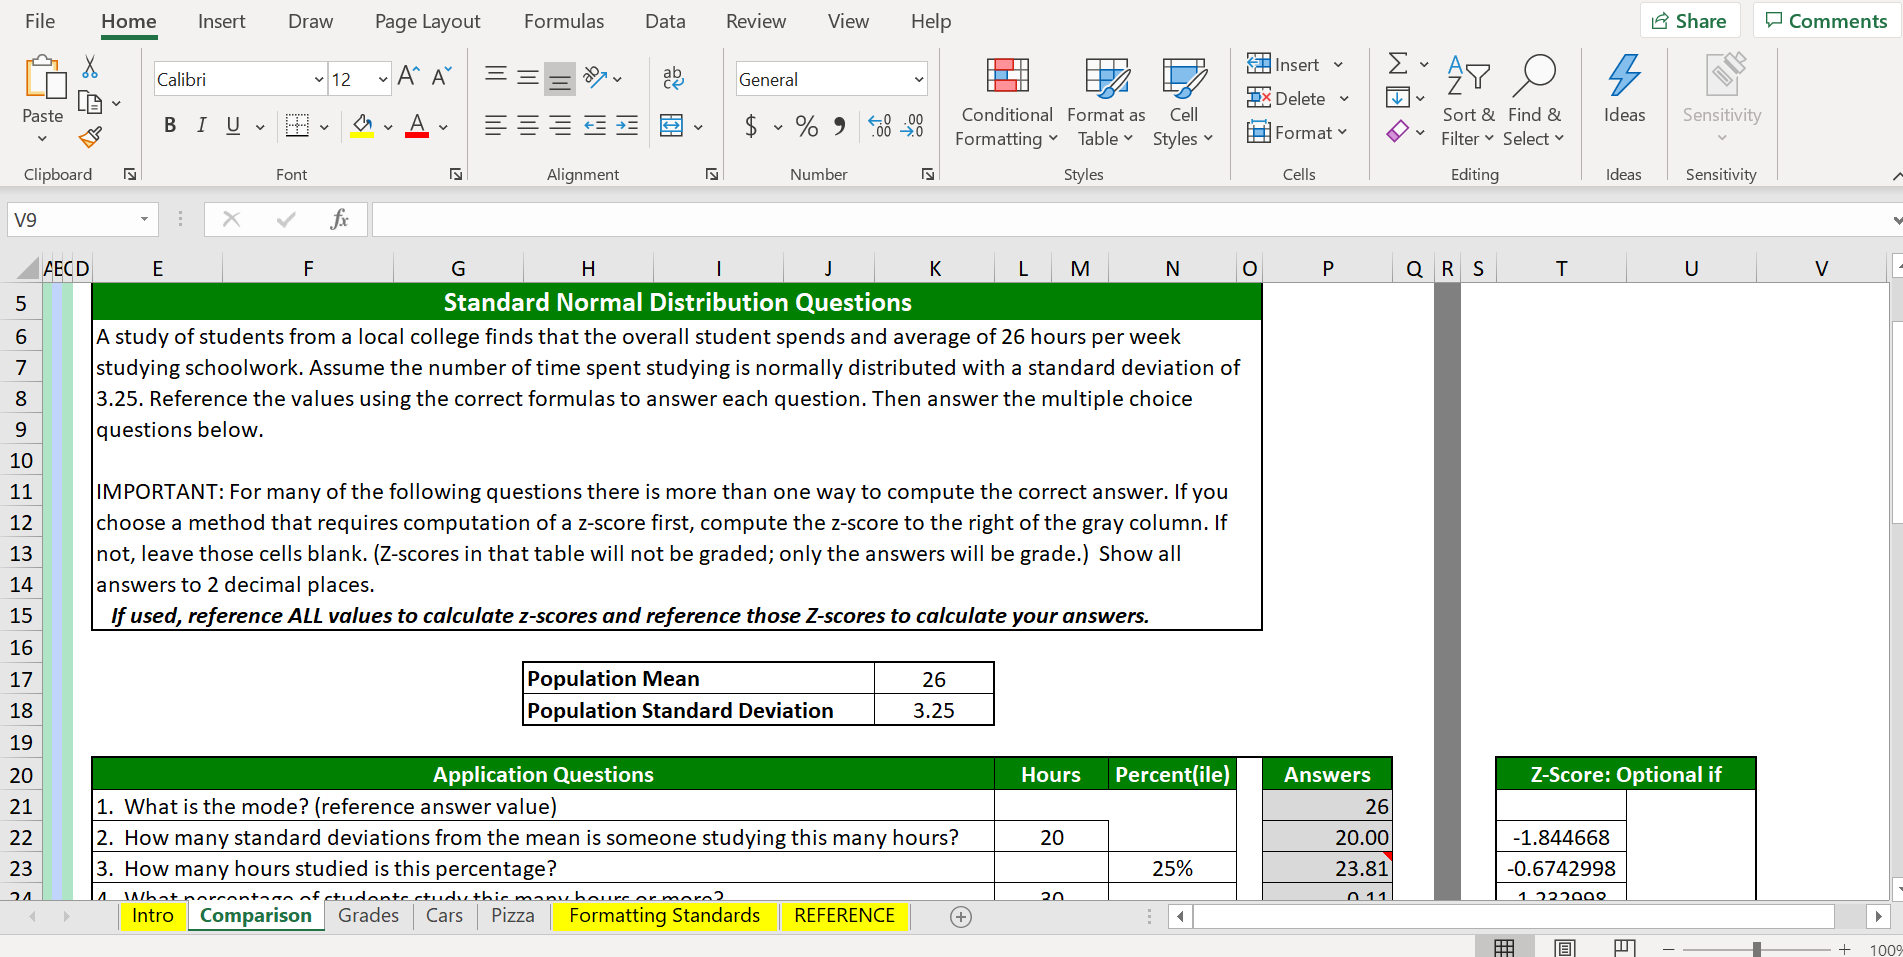
Please help me to check the answer if it is right or wrong in gray anwer column and mutiple choice
File Home Insert Draw Page Layout Formulas Data Review View Help Share Comments Calibri 12 ~ A" A = General Insert v 1x Delete Ex AY O Paste BIU ~ MyAv v $ ~ % " .00 Conditional Format as Cell Format Sort & Find & Ideas Sensitivity Formatting Table ~ Styles Filter ~ Select Clipboard Font Alignment Number Styles Cells Editing Ideas Sensitivity V9 X fx AECD E F G H K L M N O P QRS T U V 20 Application Questions Hours Percent(ile) Answers Z-Score: Optional if 21 1. What is the mode? (reference answer value) 26 22 2. How many standard deviations from the mean is someone studying this many hours? 20 20.00 -1.844668 23 3. How many hours studied is this percentage? 25% 23.81 -0.6742998 24 4. What percentage of students study this many hours or more? 30 0.11 1.232998 25 5. What percentage of students study between these number of hours? 20 24 23.72% 1.844668 -0.6136016 26 6. What percentage studies fewer than the lower hours and more than the higher hours? 18 30 11.57% -2.4602012 1.232998 27 7. How many hours studied is the top 10%? 10% 21.83 -1.2815516 28 29 30 Conceptual Questions Answers 31 1. In the scenario above, what is the "26?" Q1 32 A. Alpha Q2 33 B. Sample Statistic Q3 34 C. Population Parameter Q4 35 Q5 36 2. What does a negative Z-score mean? 37 A. The value is below the mean 38 B. The value is above the mean 39 C. The value should be subtracted from the mean Intro Comparison Grades Cars Pizza Formatting Standards REFERENCE + + 100%File Home Insert Draw Page Layout Formulas Data Review View Help IS Share Comments Calibri V 12 ~ A" A ab General Insert v Conditional Format as Cell 1x Delete Ex AY O Paste BIUV = = I V $ ~ % ? [Format Sort & Find & Ideas Sensitivity Formatting Table Styles v Filter > Select Clipboard Font Alignment Number Styles Cells Editing Ideas Sensitivity V9 X AECD E F G H - K L M N O P QRS T U V 36 2. What does a negative Z-score mean? 37 A. The value is below the mean 38 B. The value is above the mean 39 C. The value should be subtracted from the mean 40 41 3. When you want to fairly compare two values from different 42 distributions, what should you use? 43 A. Their standard deviations 44 B. Their z-scores 45 C. Their absolute value of their means 46 47 4. In a standard normal distribution, what is the Z-score equal to? 48 A. The standard deviation 49 B. The population mean 50 C. The sample mean 51 52 5. What is the standard deviation of a data set? 53 A. The sum of the distance between each data point in the data set 54 B. The variance squared 55 C. The average difference from the data points to the mean Intro Comparison Grades Cars Pizza Formatting Standards REFERENCE + + 100%File Home Insert Draw Page Layout Formulas Data Review View Help 6 Share Cl Comments 2% v A v v Elnsen v Z v A p , 7% E": [a V A A General III % W EDelete v v z? _ E Paste 0' v A v $ v % 9 (33 438 Conditional Format as Cell ,_ v v Spit BA Find 82 Ideas SensitiVity V 6 Formatting V Table V Styles V E Format 0 Filter V Select V V Clipboard Is Font is Number Is Styles Cells Editing Ideas Sensitivity v9 v r v A - P | o. R s l T | U l v l: 5_ Standard Normal Distribution Questions i Astudy ofstudentsfroma local college findsthatthe overall student spends and average of26 hours per week 7 7_ studying schoolwork, Assume the number oftime spent studying is normally distributed with a standard deviation of 8* 325. Reference the values usingthe correct formulas to answer each question. Then answer the multiple choice i questions below. 13 L IMPORTANT: For many ofthe following questions there is more than one way to compute the correct answer. If you 1; choose a method that requires computation of a zscore first, compute the z-score to the right of the gray column, If a I; not, leave those cells blank. (Zscores in that table will not be graded; only the answers will be grade.) Show all 1i answerstoZdecimal places. 15 If used, reference ALL values to calculate z-scores and reference those Zscores to calculate your answers. 16 11 Population Mean 26 1E Population Standard Deviation 3.25 11 23 Application Questions Hours Percent(ile) Answers Z-Score: Optional if 21 1. Whatisthe mode?(referenceanswervalue) 26 22 2. How many standard deviationsfrom the mean is someone studying this many hours? 20 20.00 4.844668 23 3, How many hours studied is this percentage? 25% 23.81' 0.6742998 , in A mm + new--- .; sugge+ .4. .41..- m m manage: an A.\" 1 121m 2 l Intro Comparison Grades l Cars I Pizza l Formatting Standards l REFERENCE l (-9 E 4 b Eli lEl |I|'| iI'l' 1009


