

Answered step by step
Verified Expert Solution
Question
1 Approved Answer
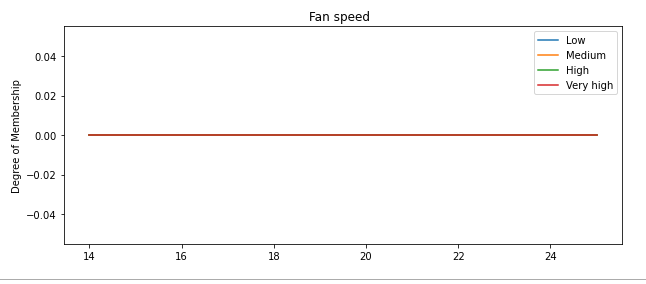
please help me to fix my graph to see the other line graph of the graph import numpy as np import matplotlib.pyplot as plt temperature
please help me to fix my graph to see the other line graph of the graph
import numpy as np
import matplotlib.pyplot as plt
temperaturerange nparange
def Low x:
return npmaximum npminimum x
def Medium x:
return npmaximum npminimumnpminimumx x
def High x:
return npmaximum npminimumnpminimumx x
def Veryhighx:
return npmaximum npminimumnpminimumx x
pltfigurefigsize
pltplottemperaturerange, Lowtemperaturerange label"Low"
pltplottemperaturerange, Mediumtemperaturerange label"Medium"
pltplottemperaturerange, Hightemperaturerange label"High"
pltplottemperaturerange, Veryhightemperaturerange label"Very high"
plttitleFan speed
pltxlabel
pltylabelDegree of Membership"
pltlegend
pltshow
Fan speed
Step by Step Solution
There are 3 Steps involved in it
Step: 1

Get Instant Access to Expert-Tailored Solutions
See step-by-step solutions with expert insights and AI powered tools for academic success
Step: 2

Step: 3
Ace Your Homework with AI
Get the answers you need in no time with our AI-driven, step-by-step assistance
Get Started
SQL For Data Science Data Cleaning Wrangling And Analytics With Relational Databases
Authors: Antonio Badia
1st Edition
3030575918, 978-3030575915