please help me with 1-8 and 9 - 14 a-e thank you
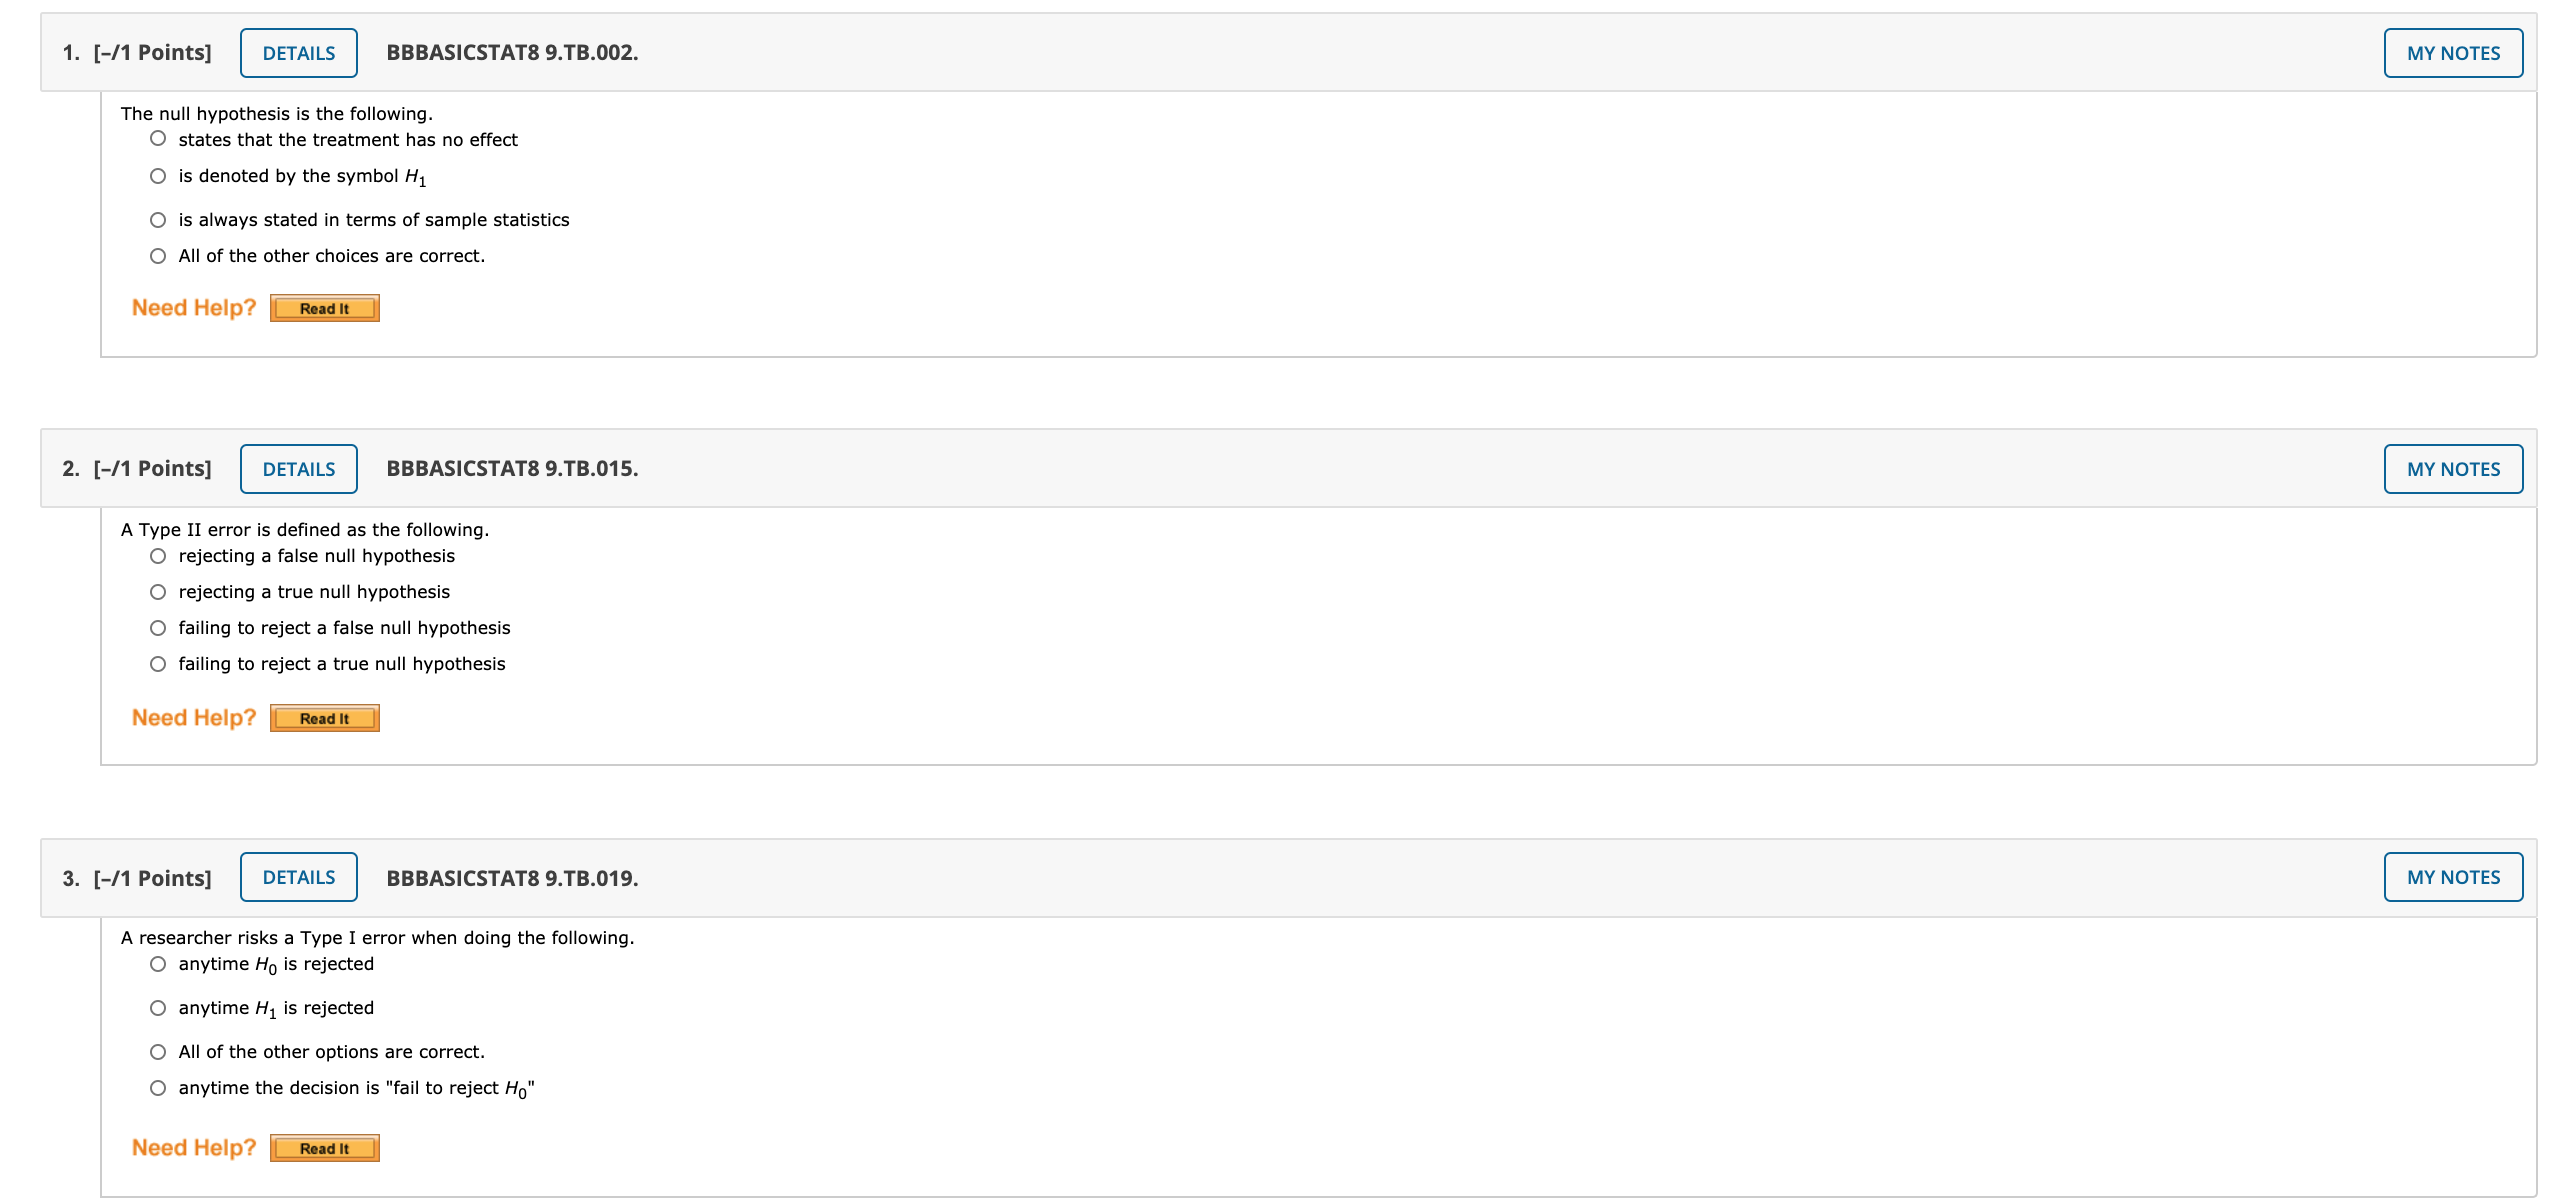
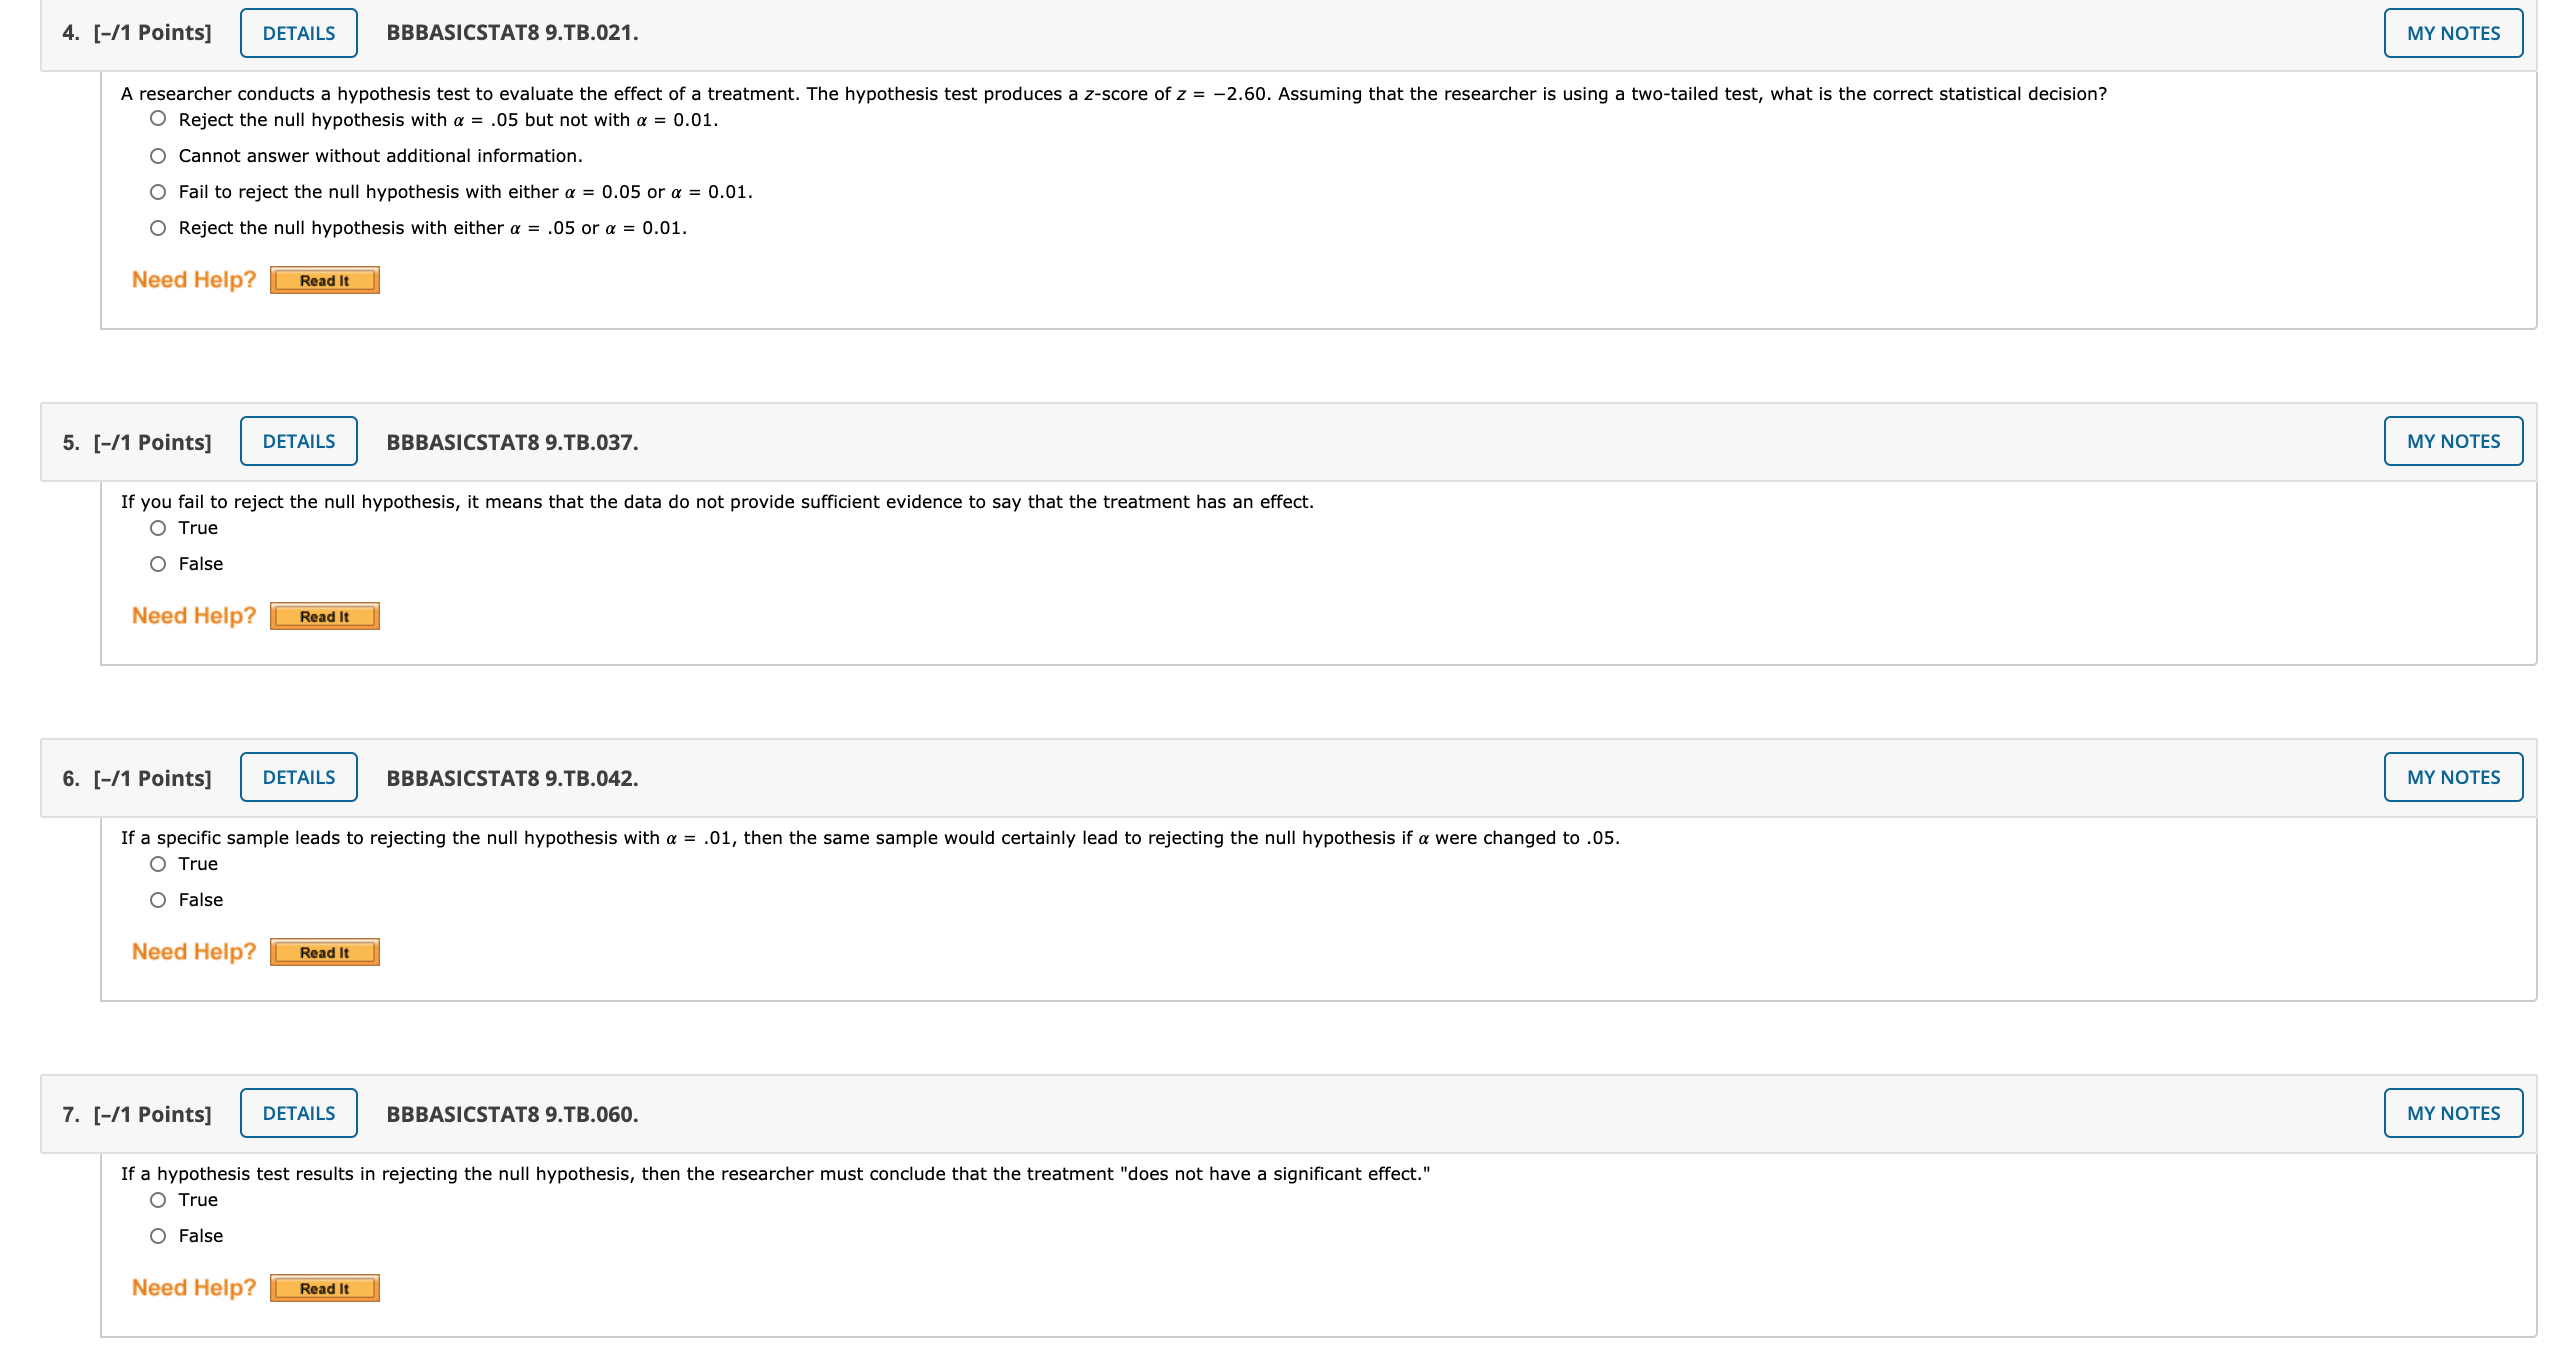
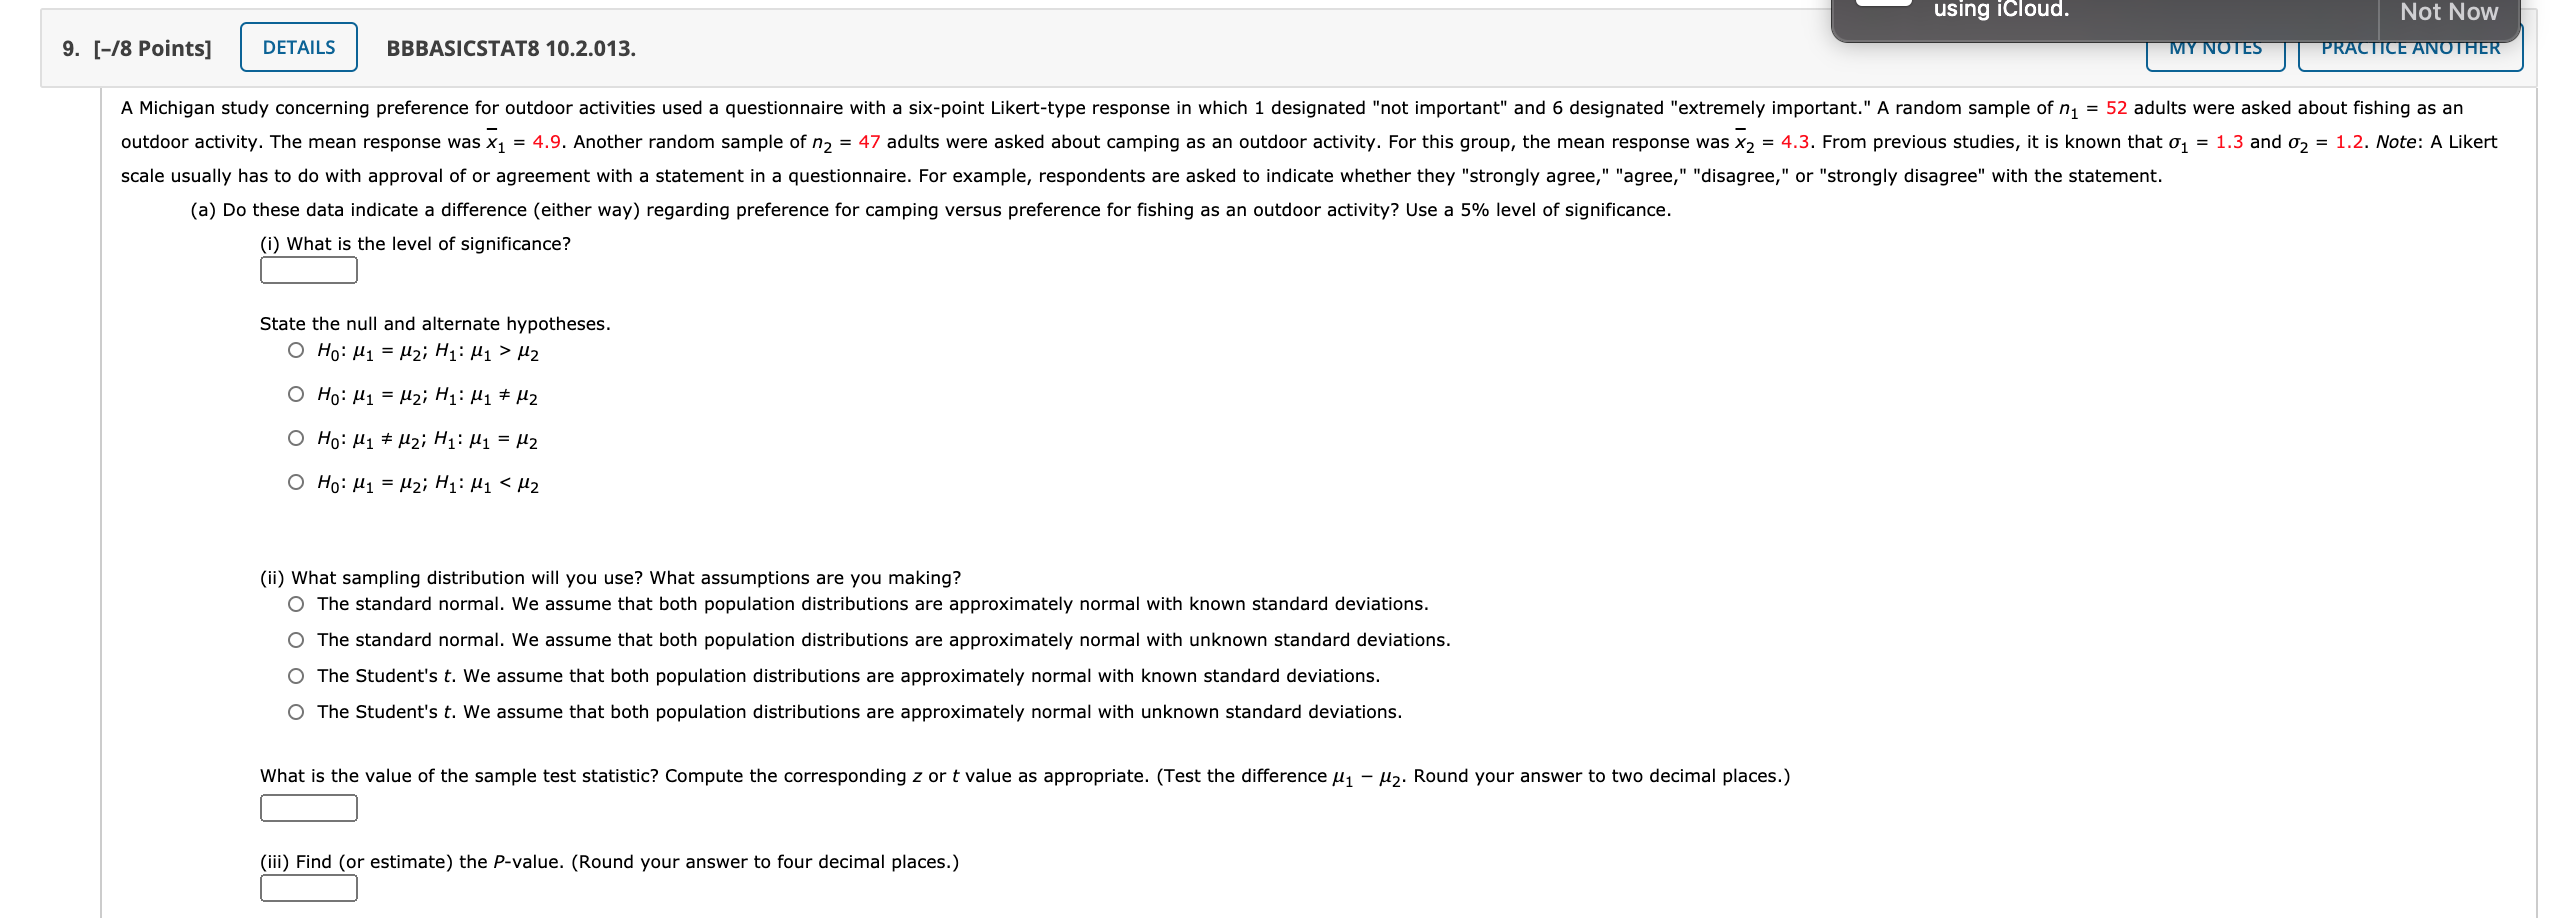
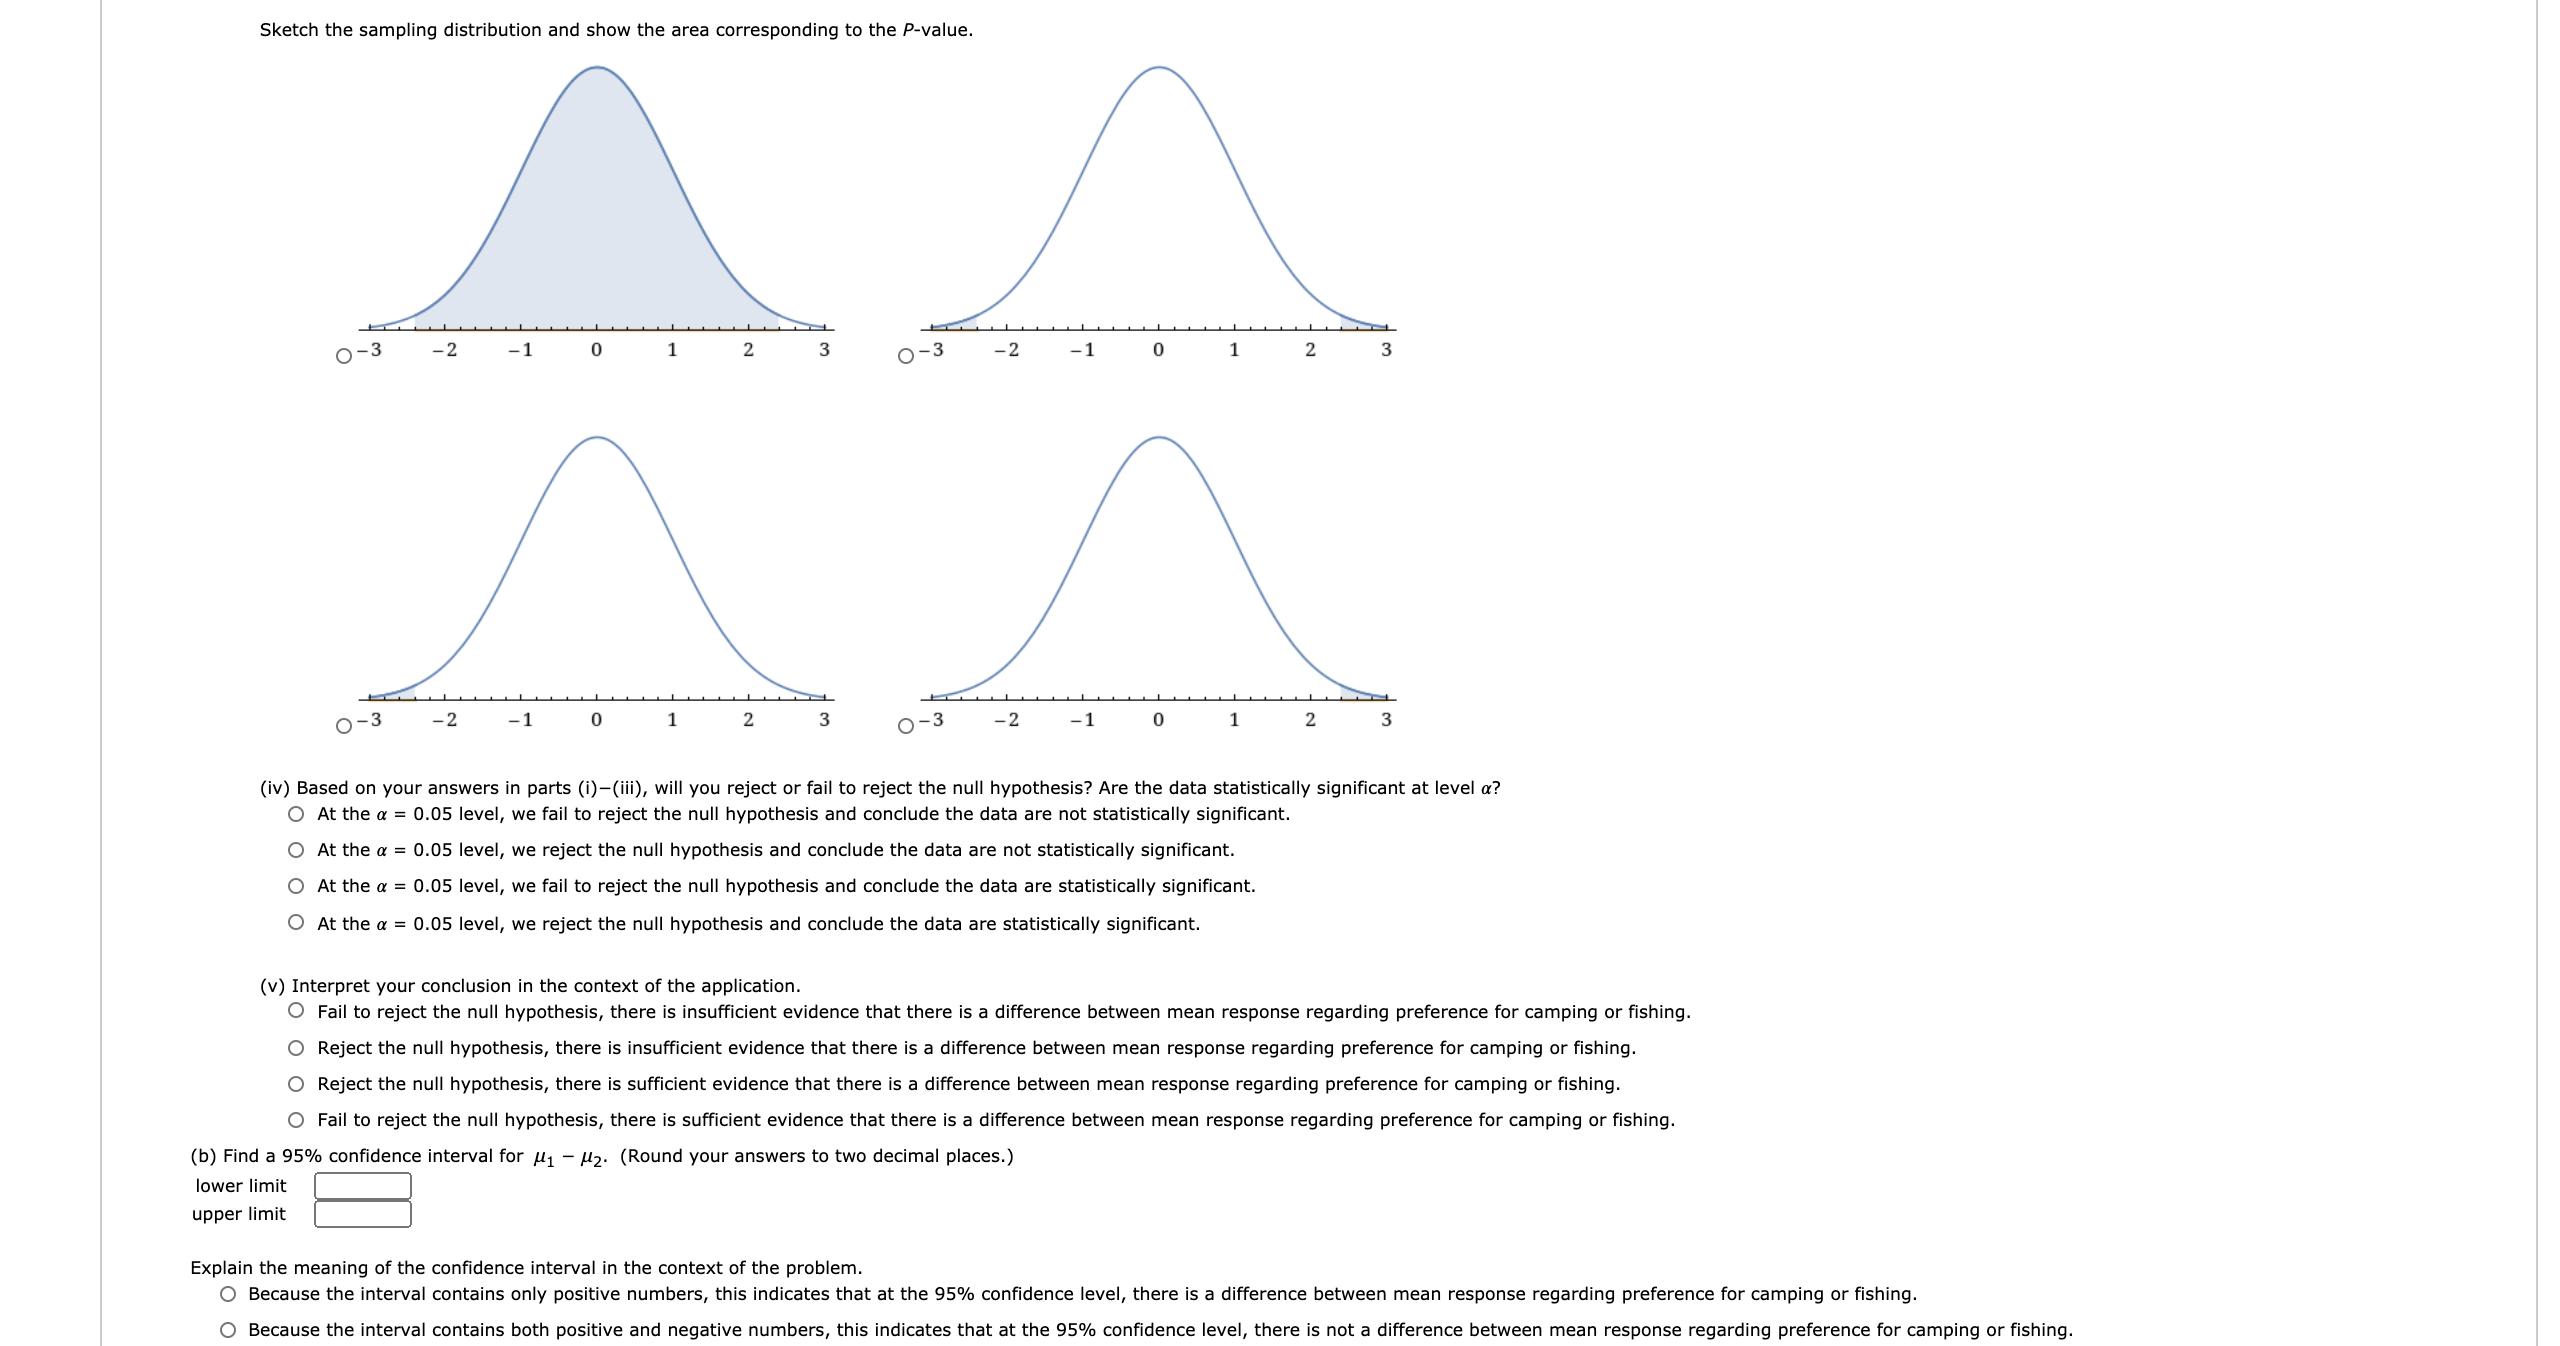
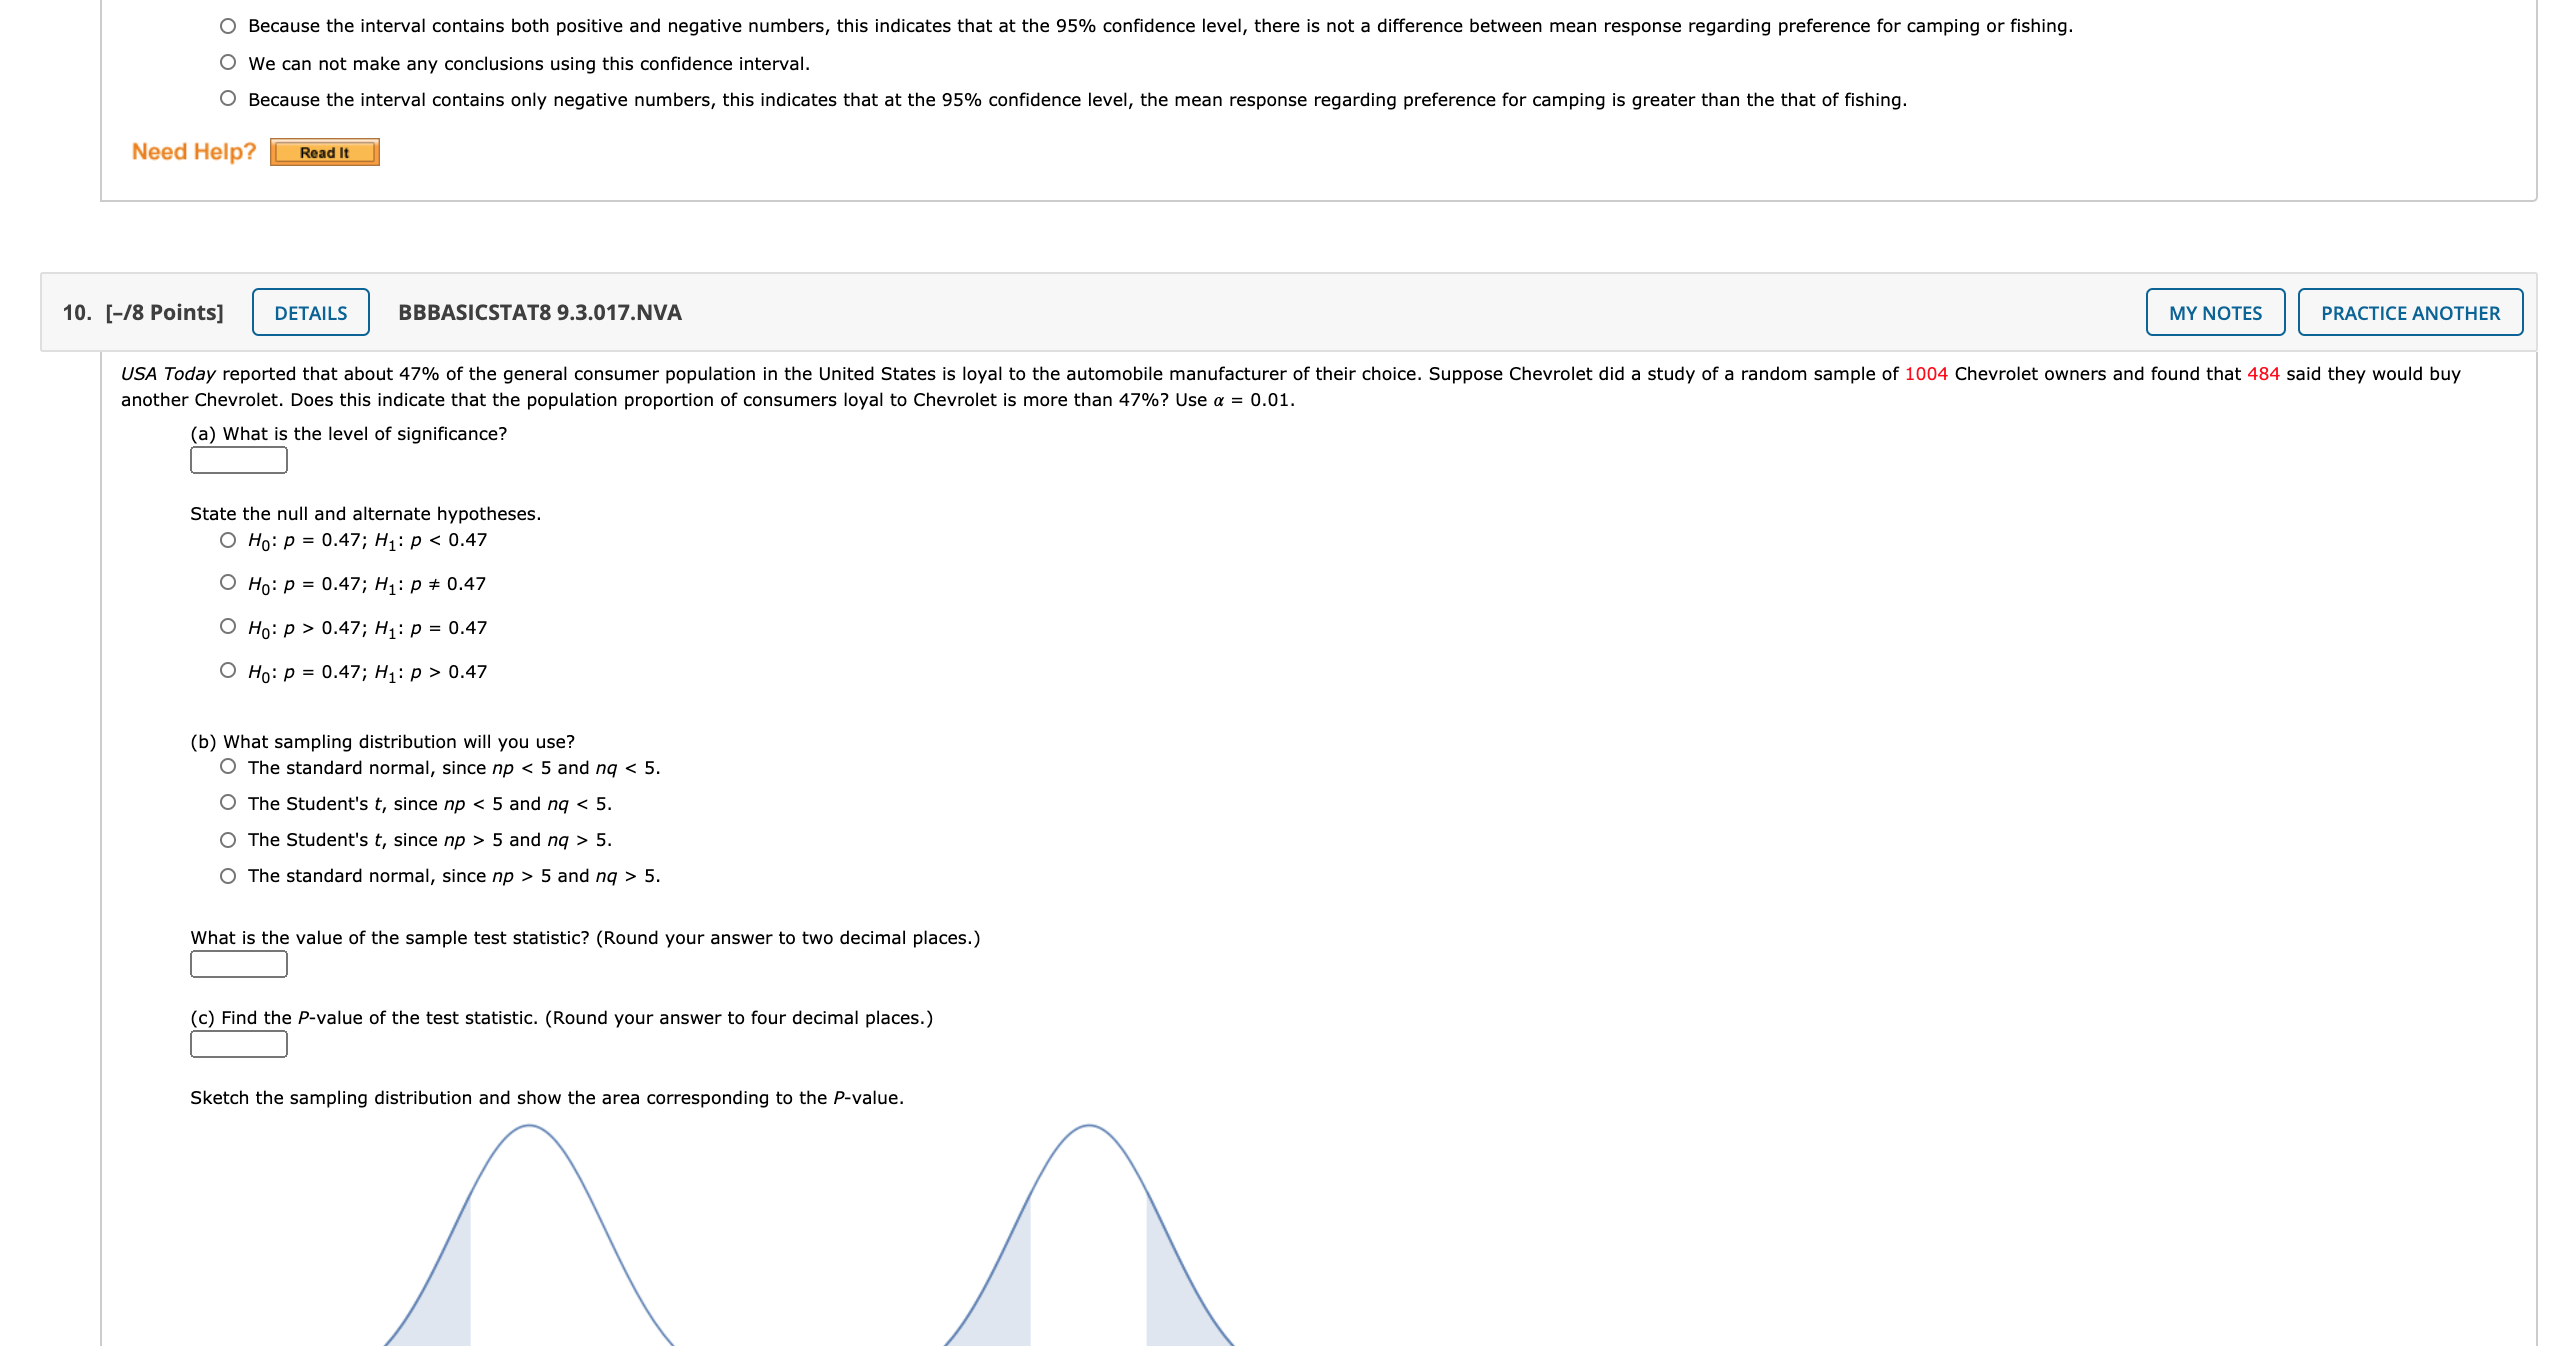
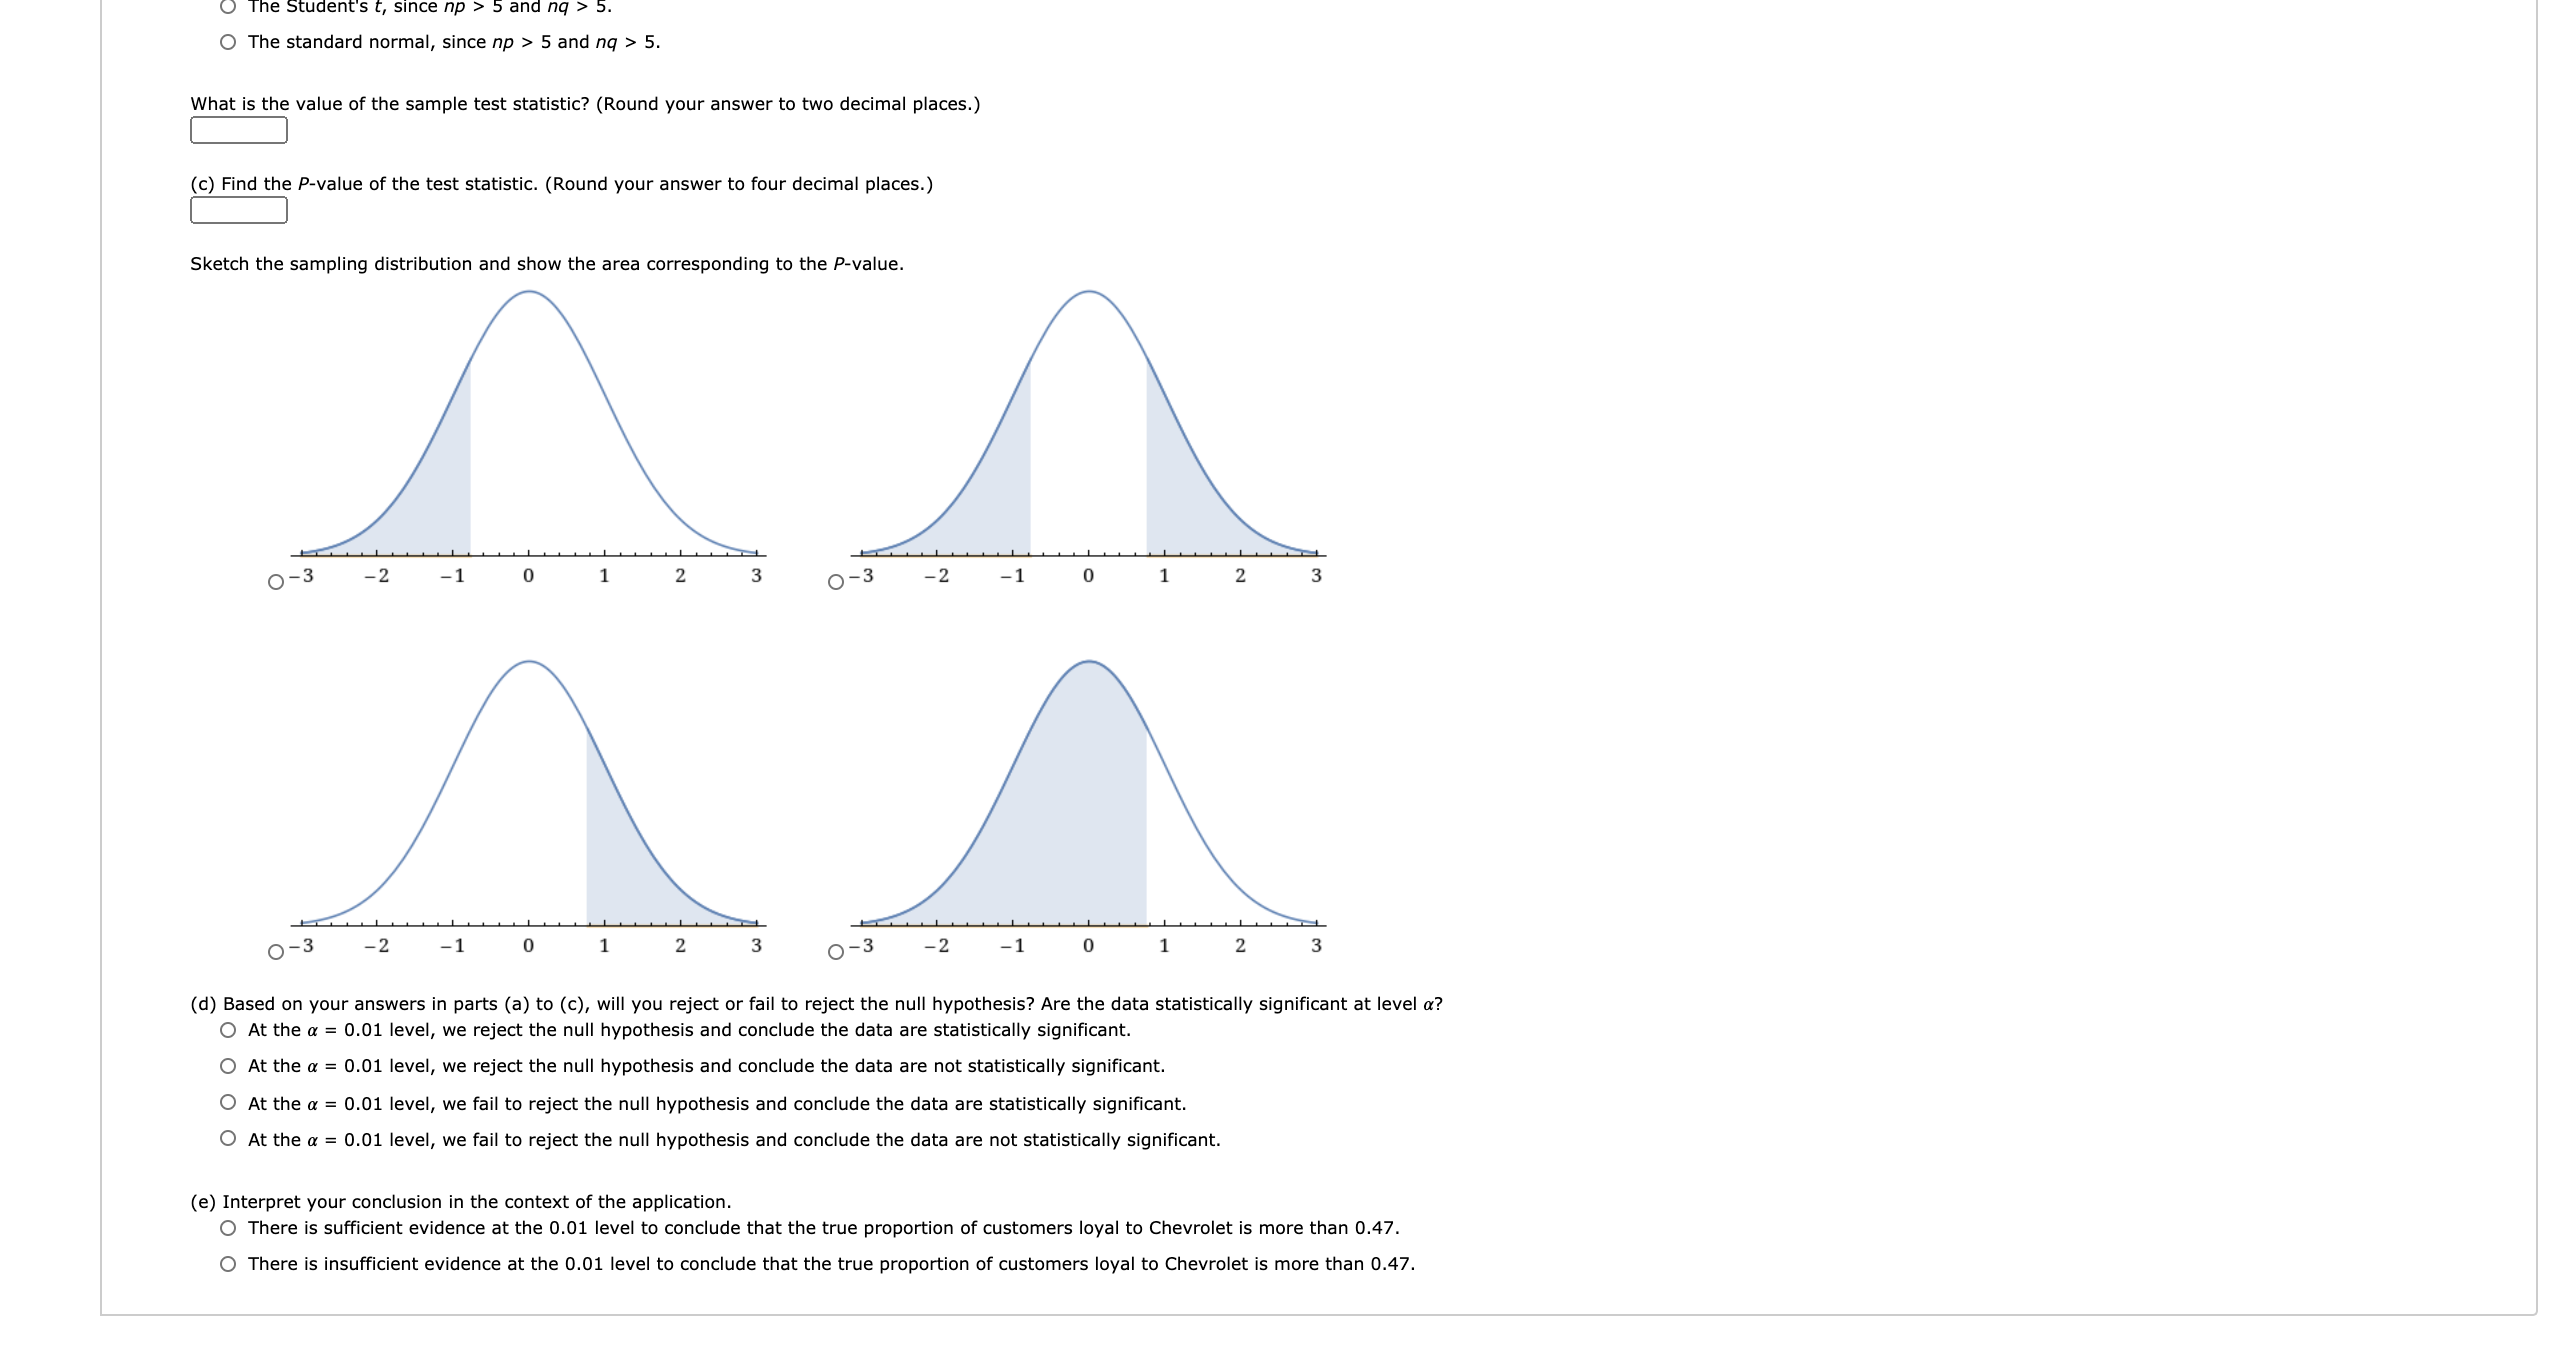
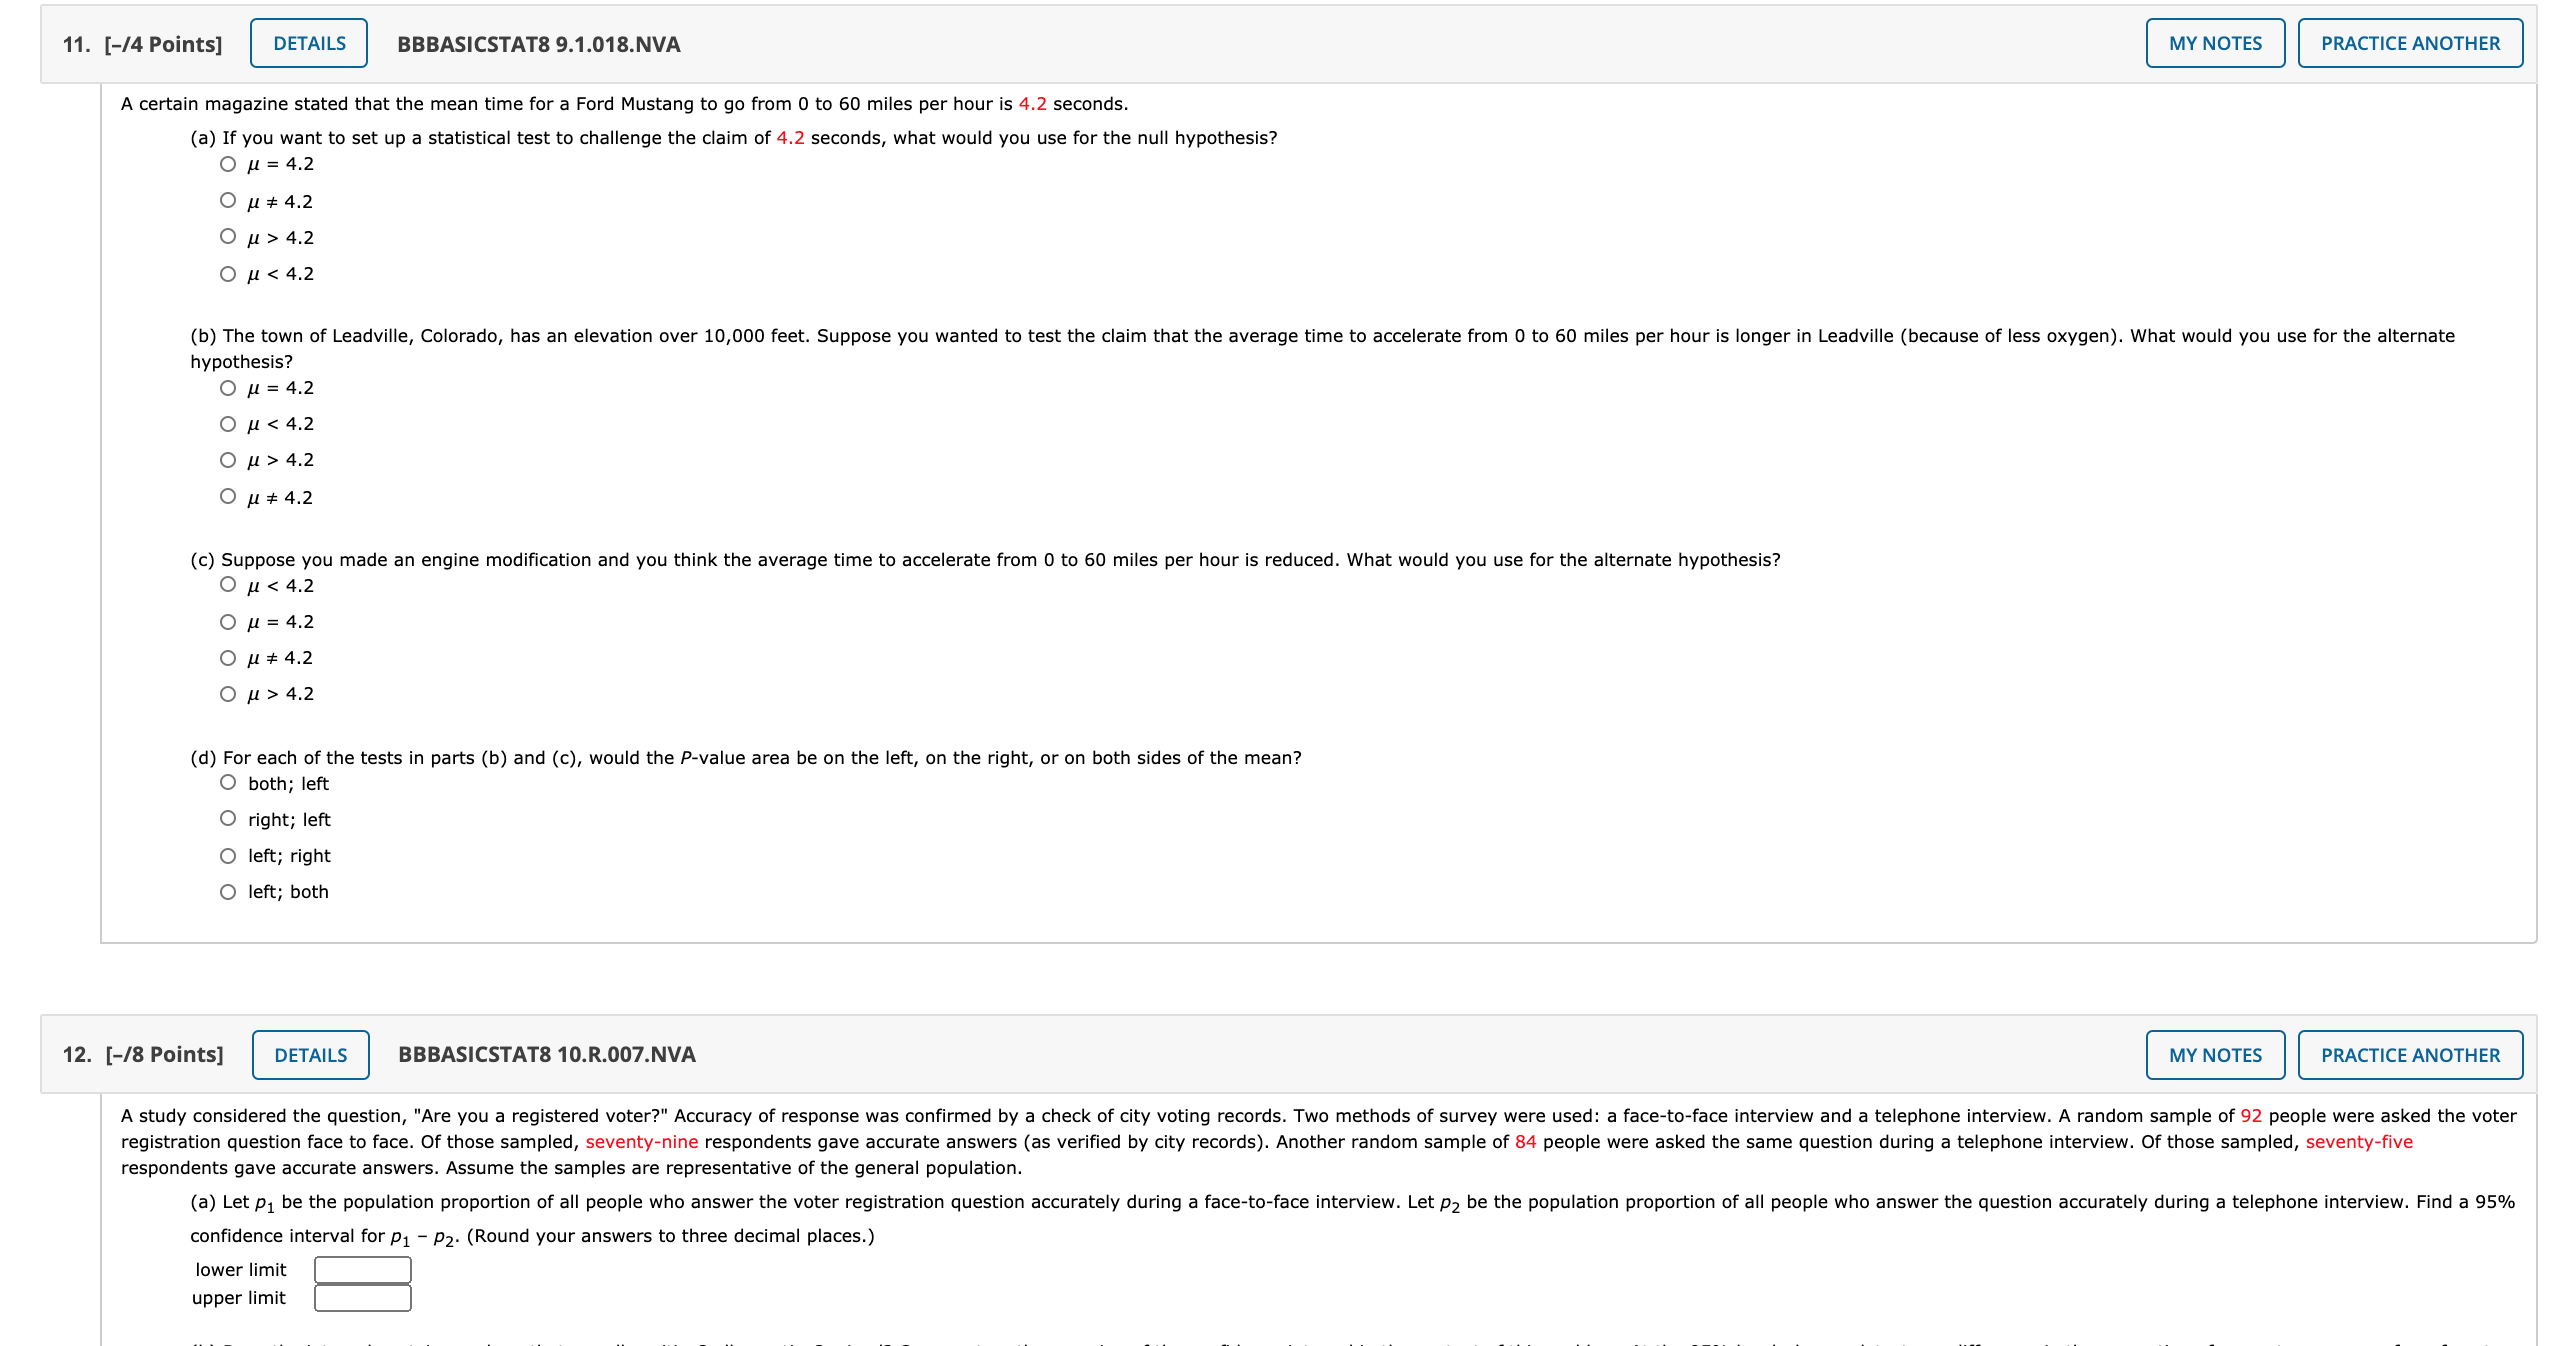
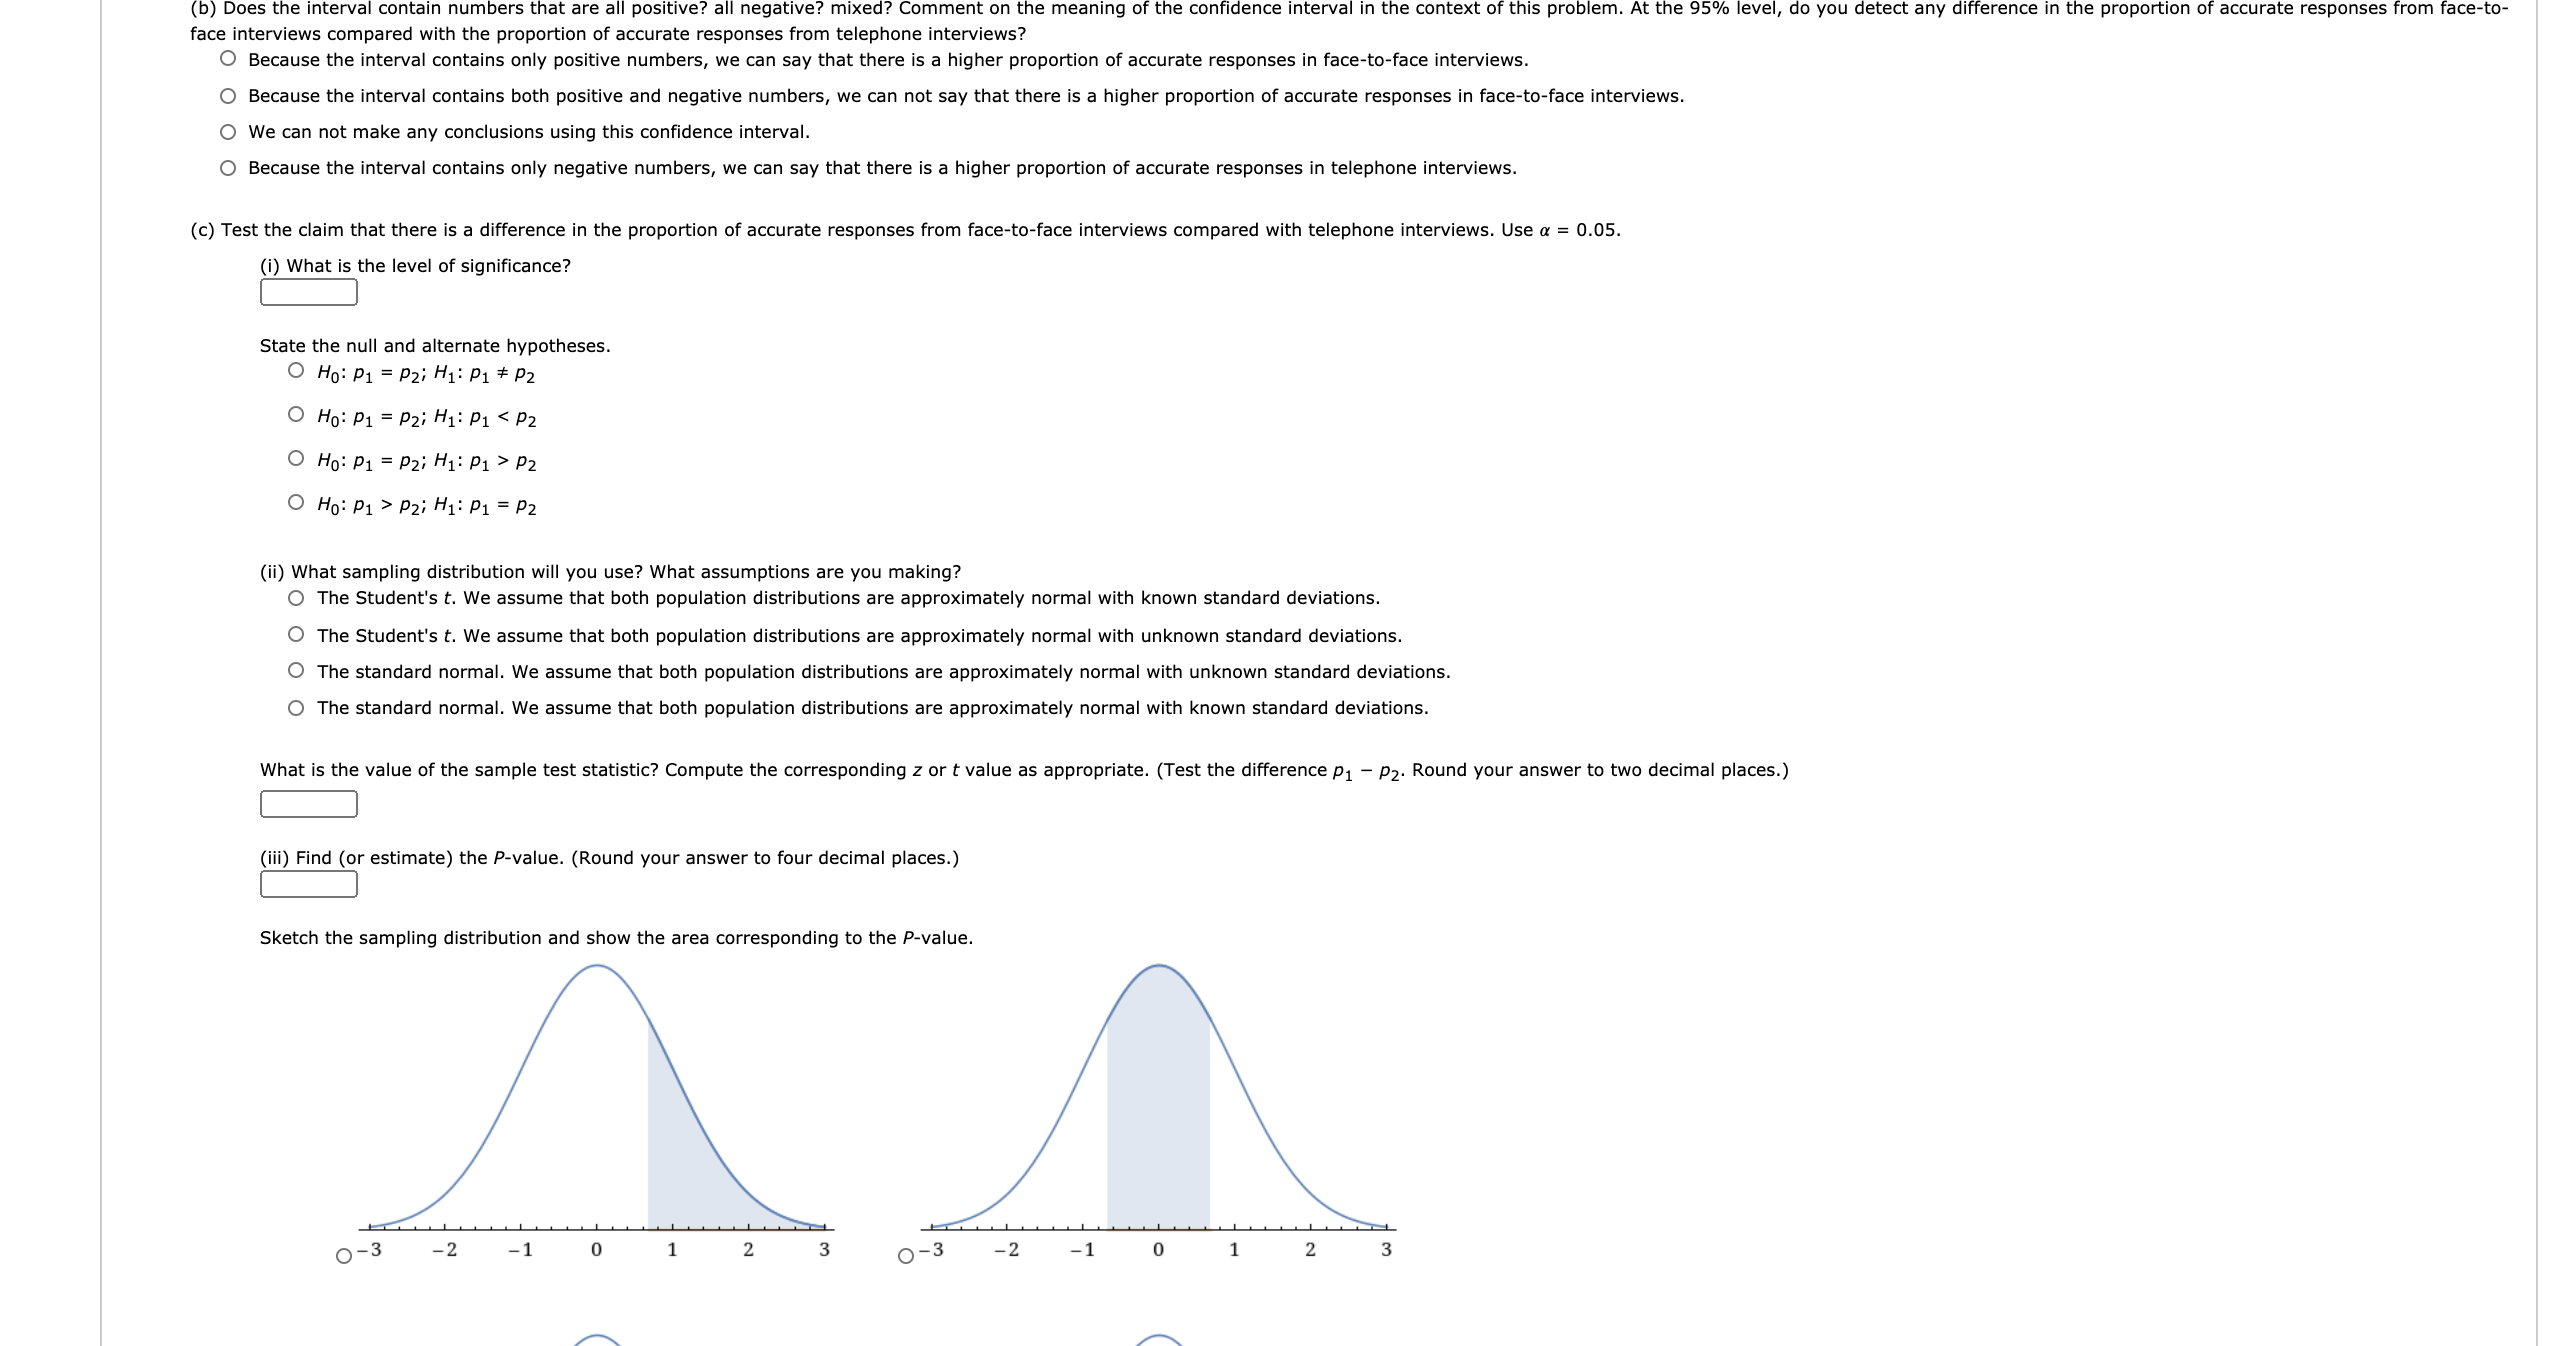
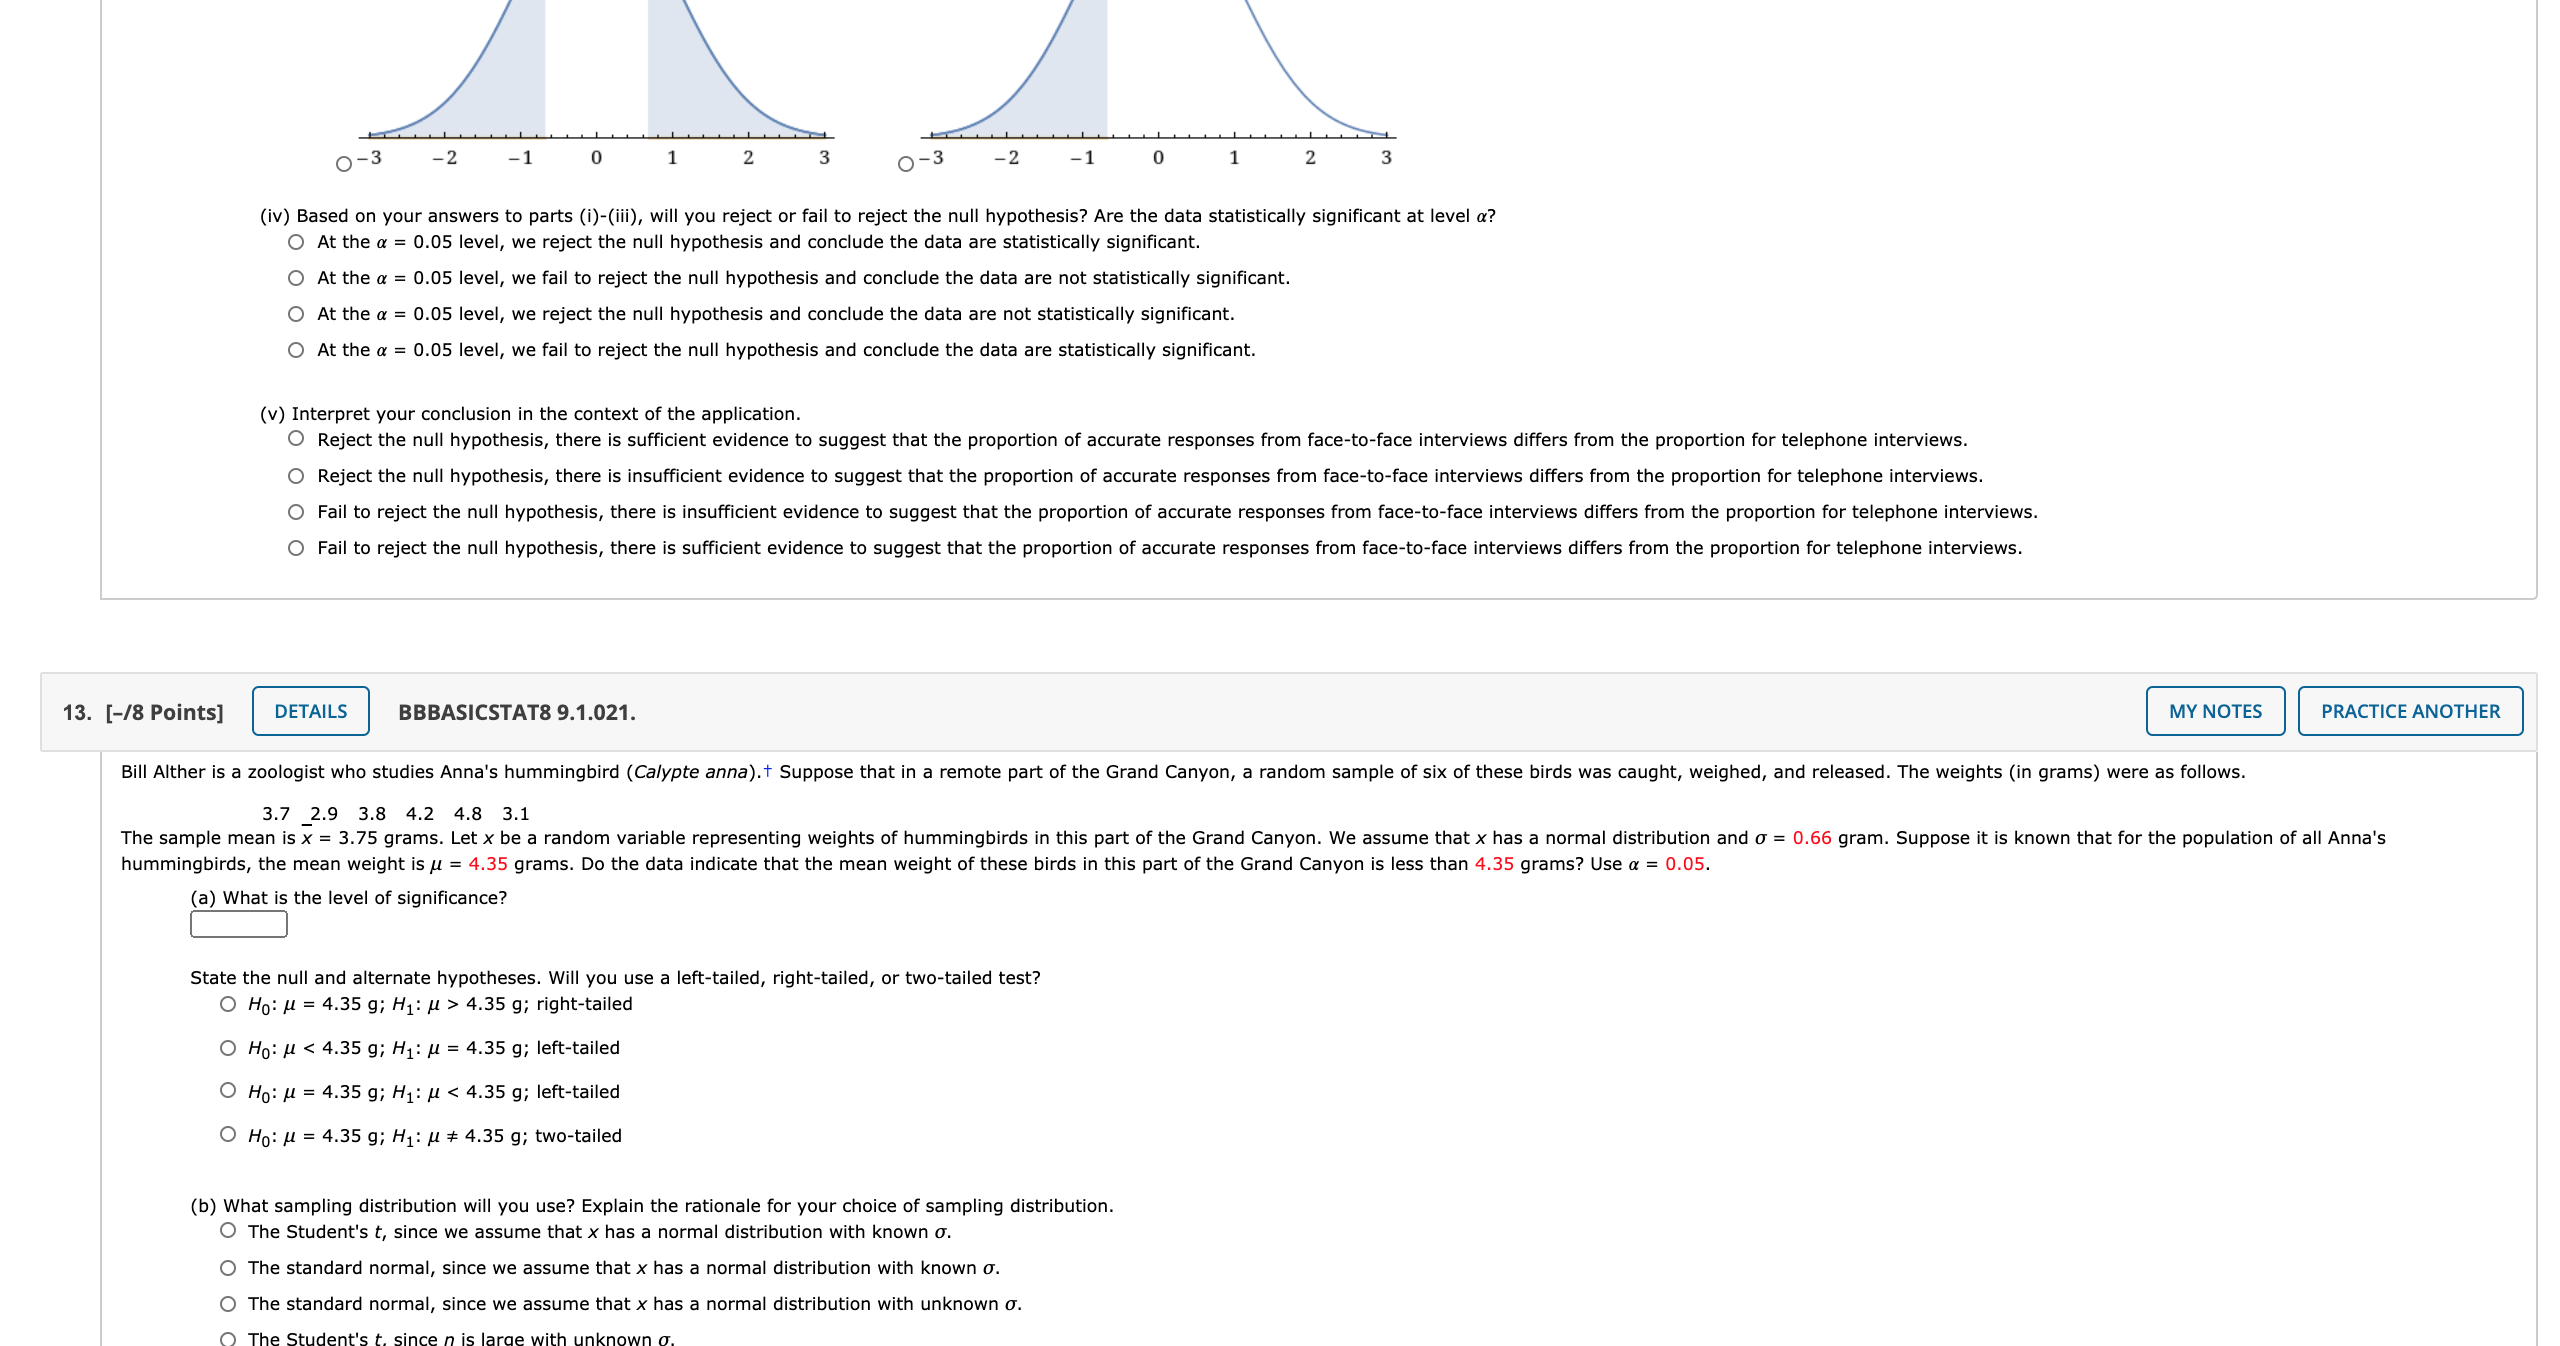
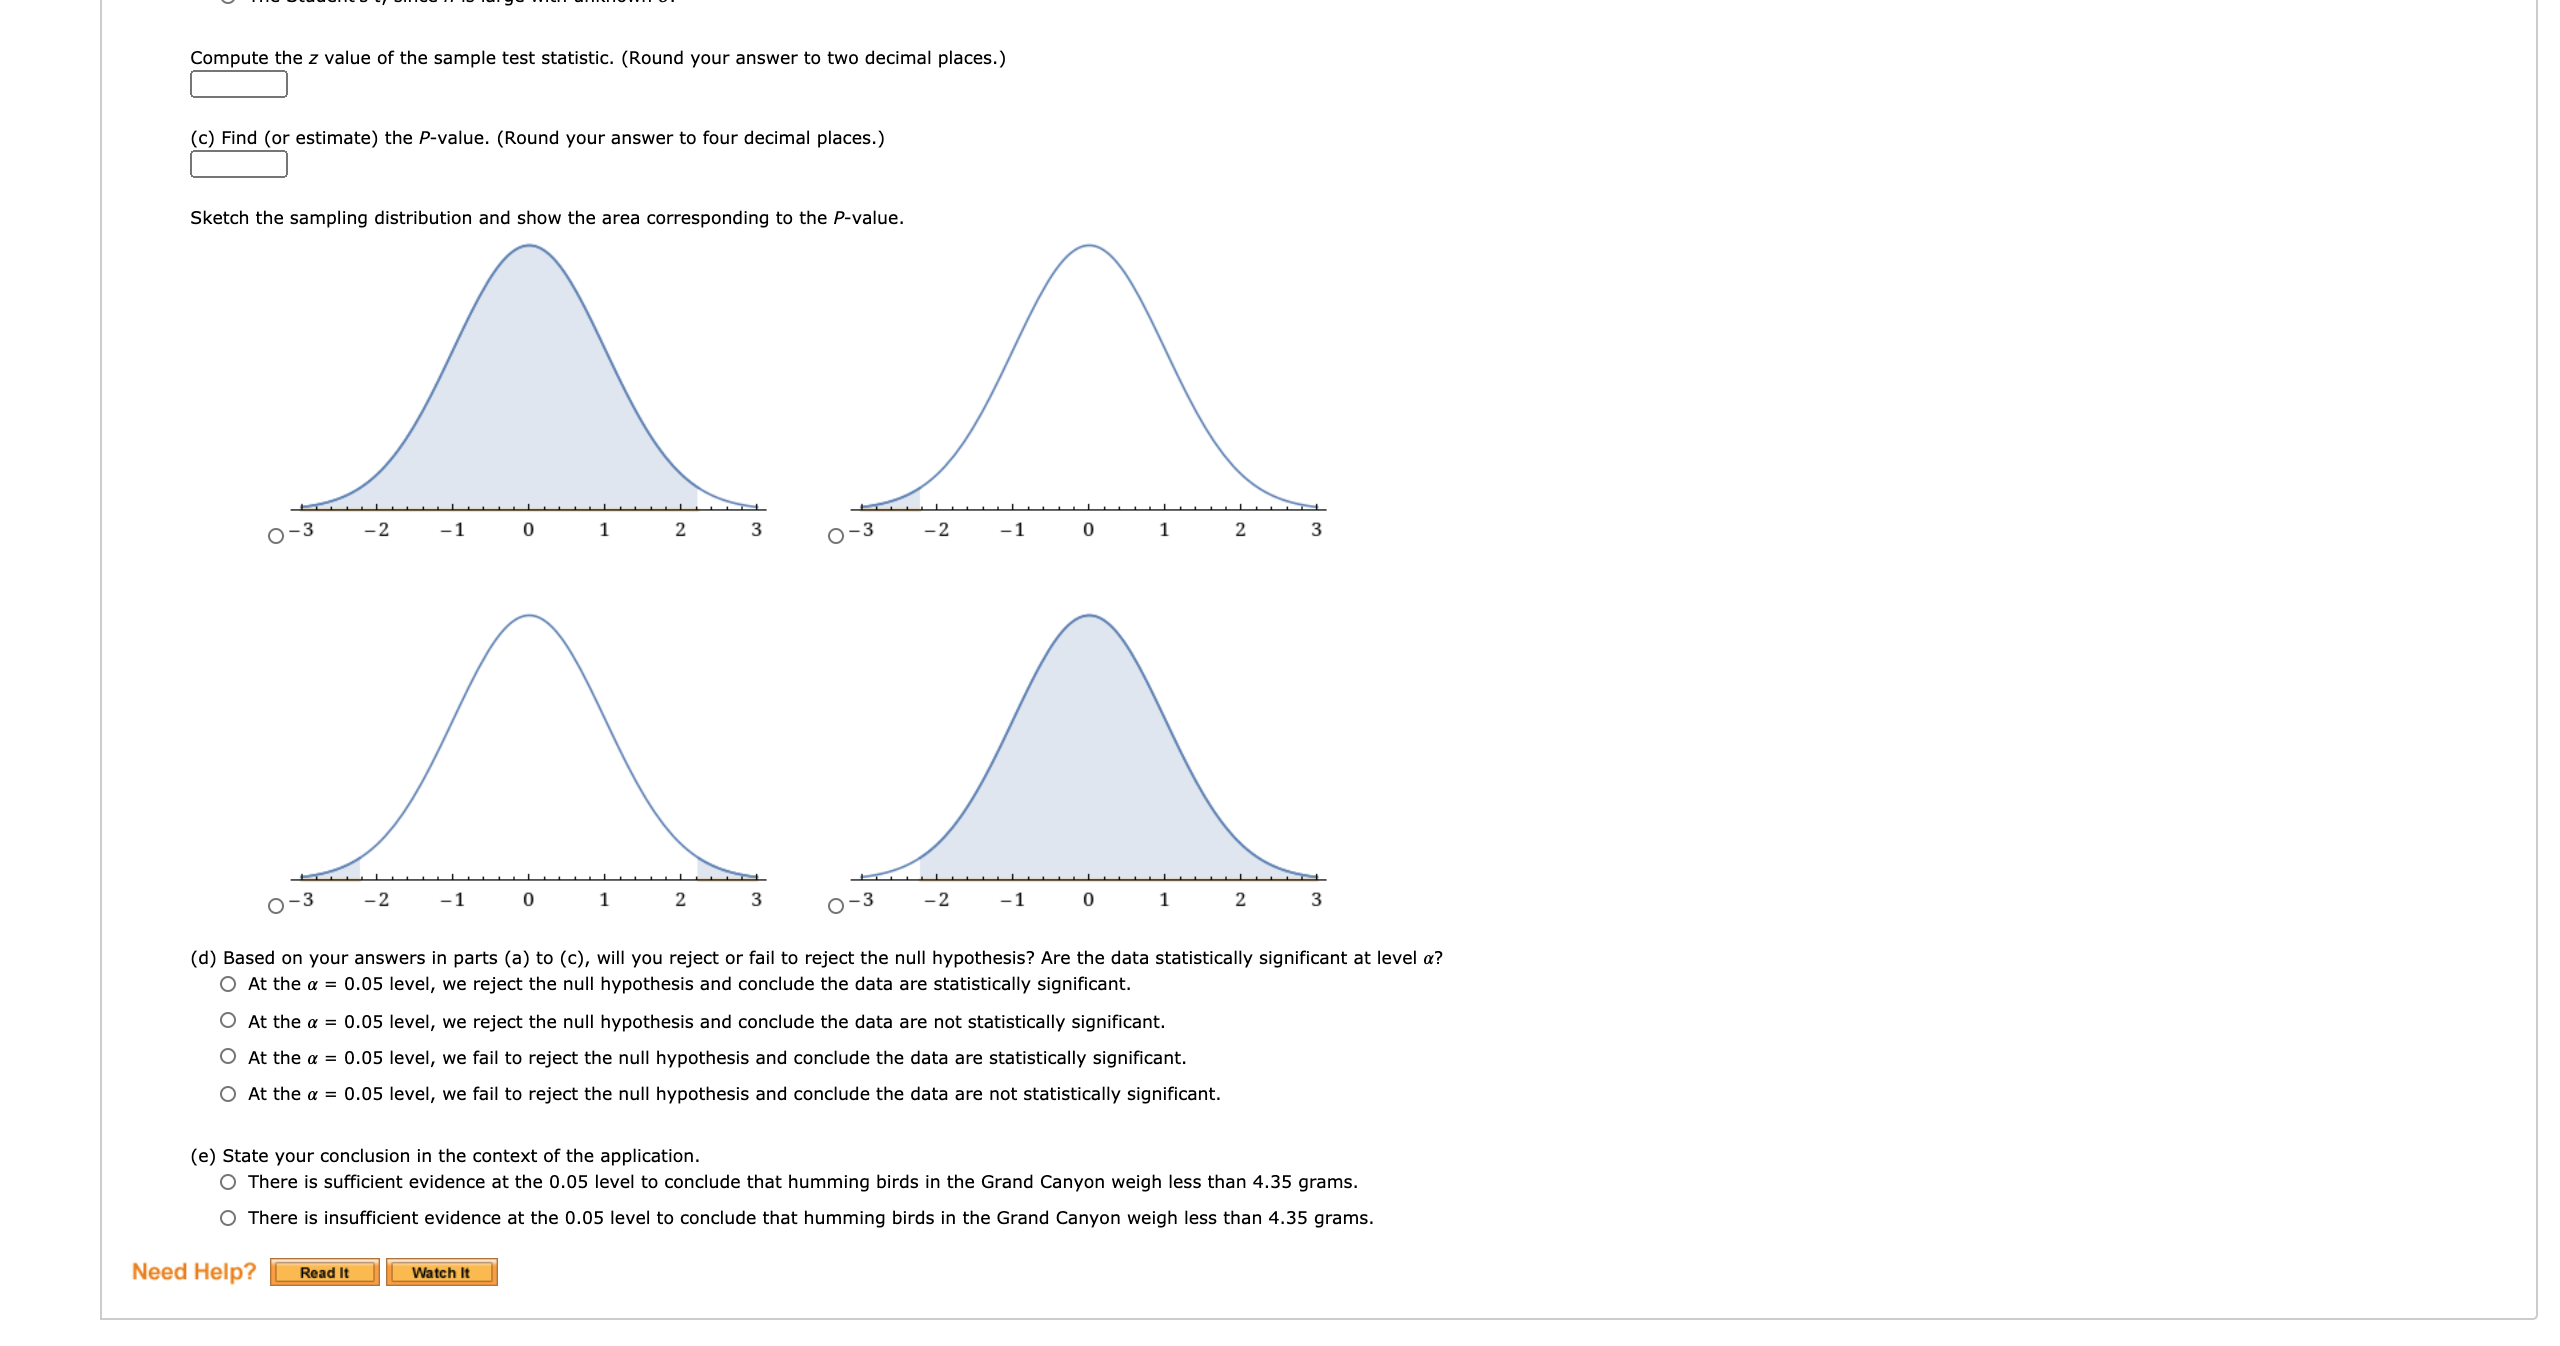
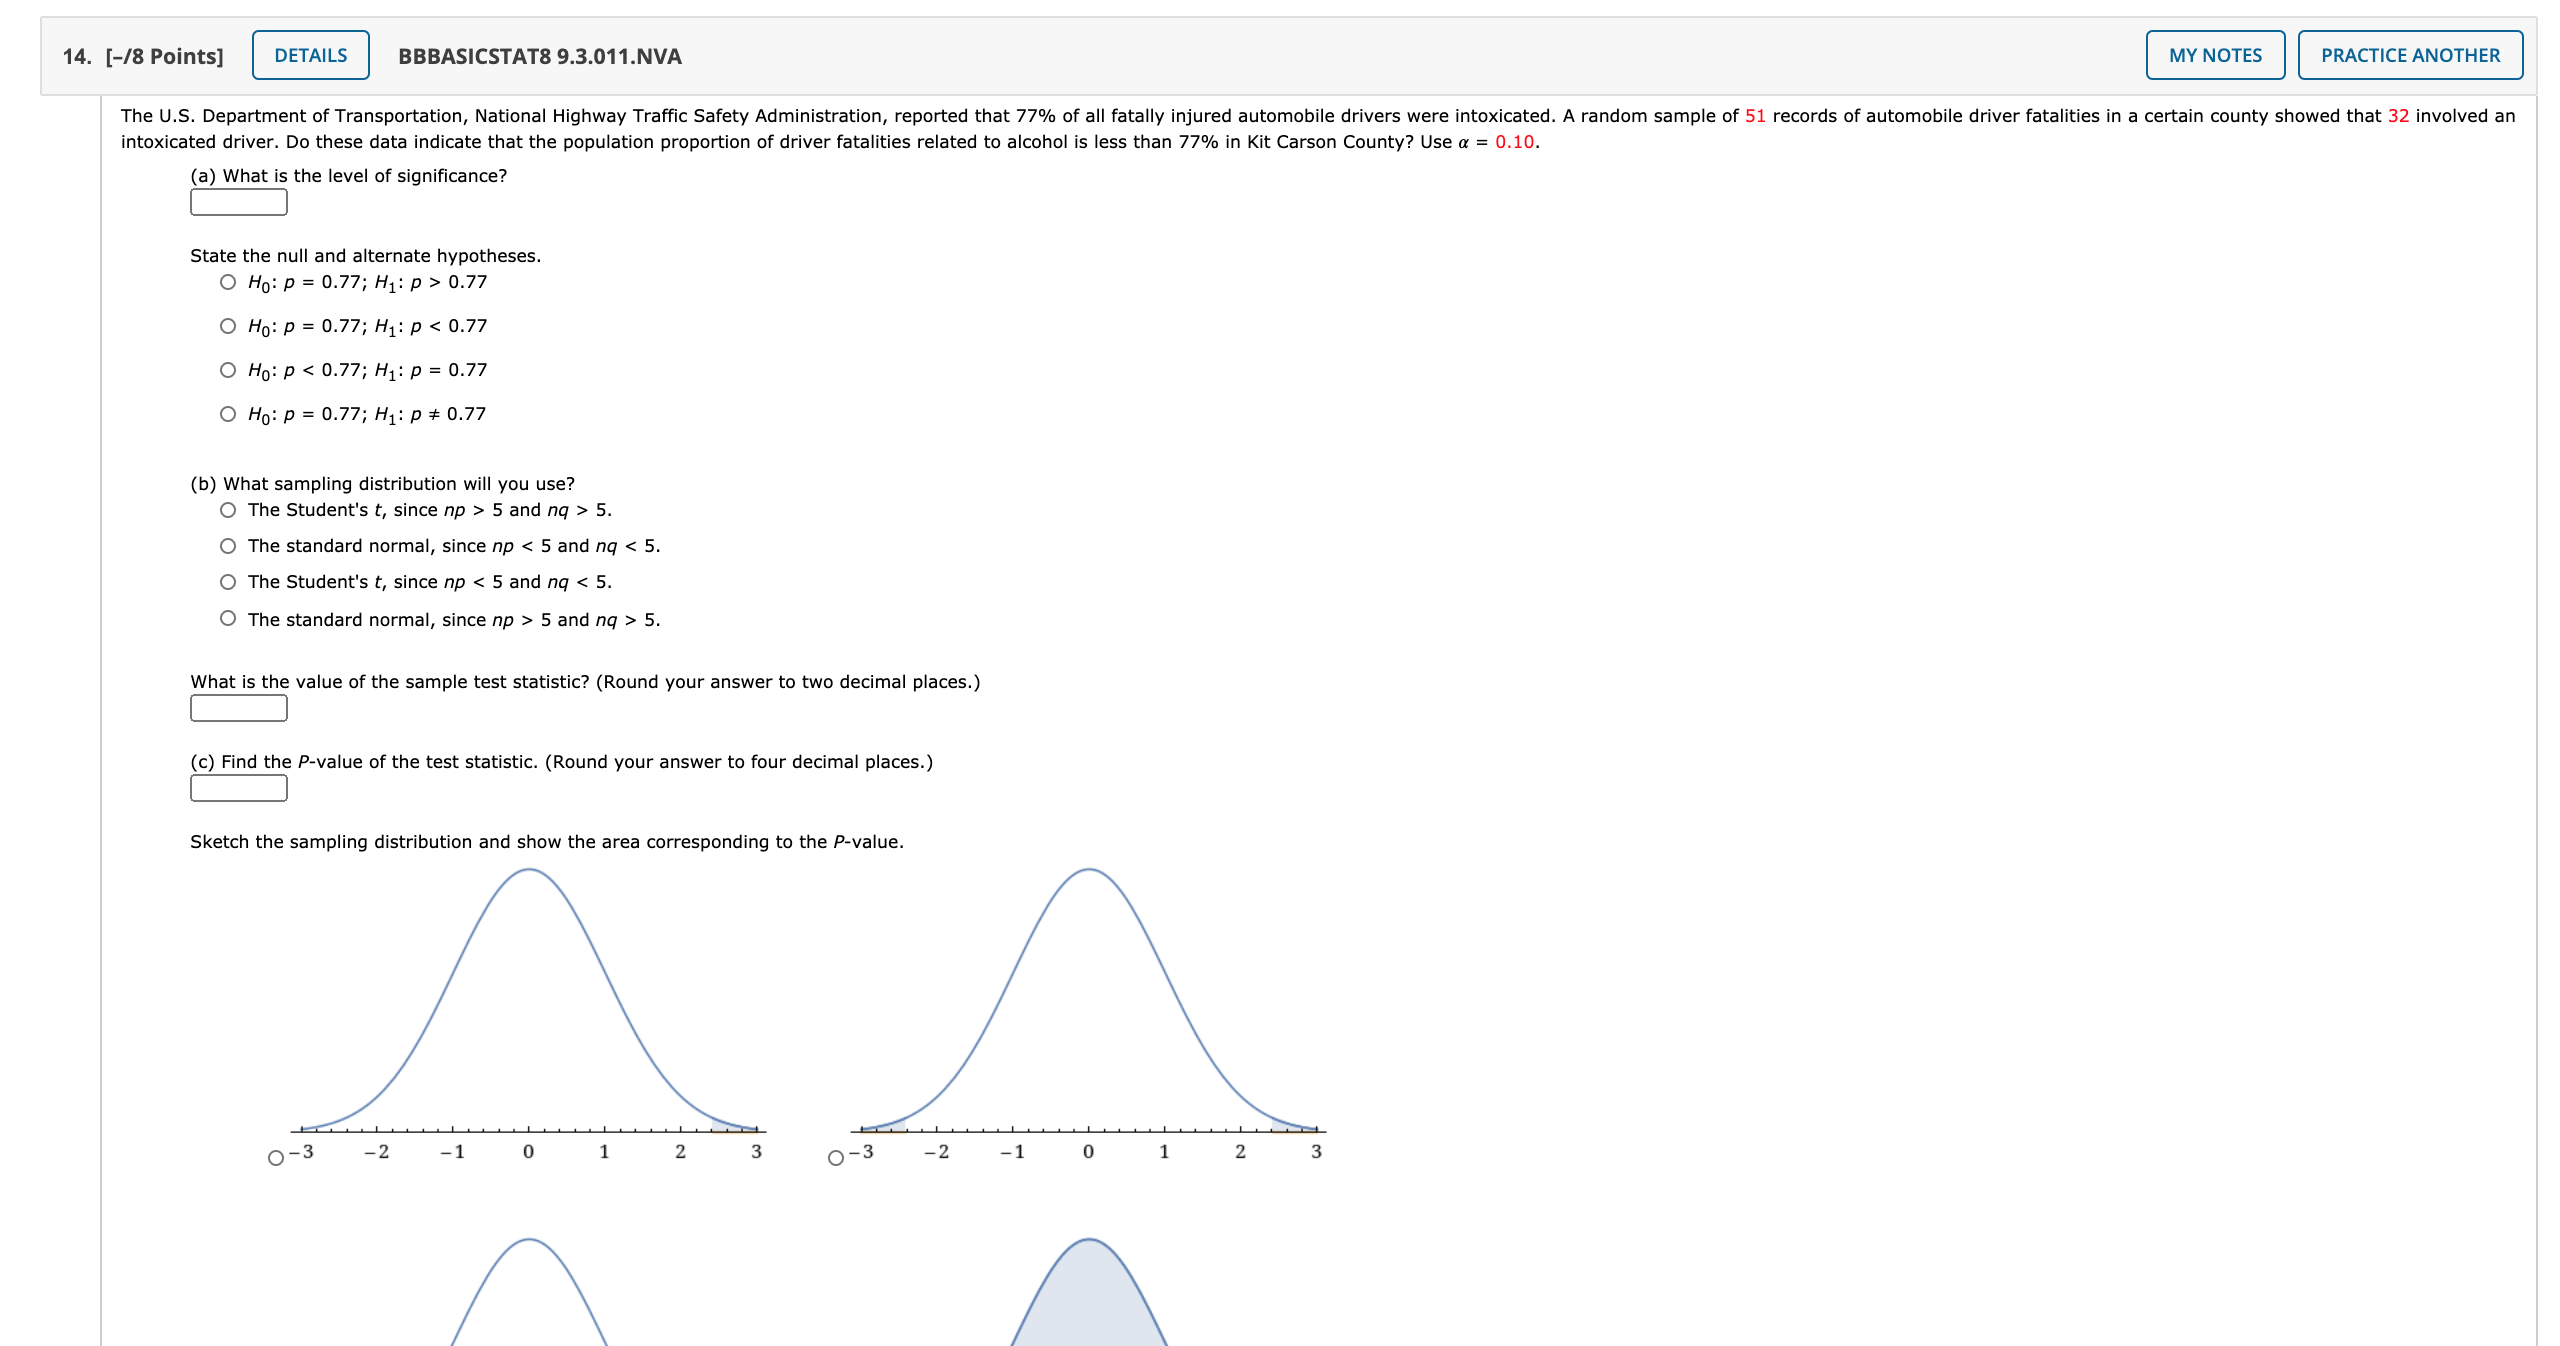
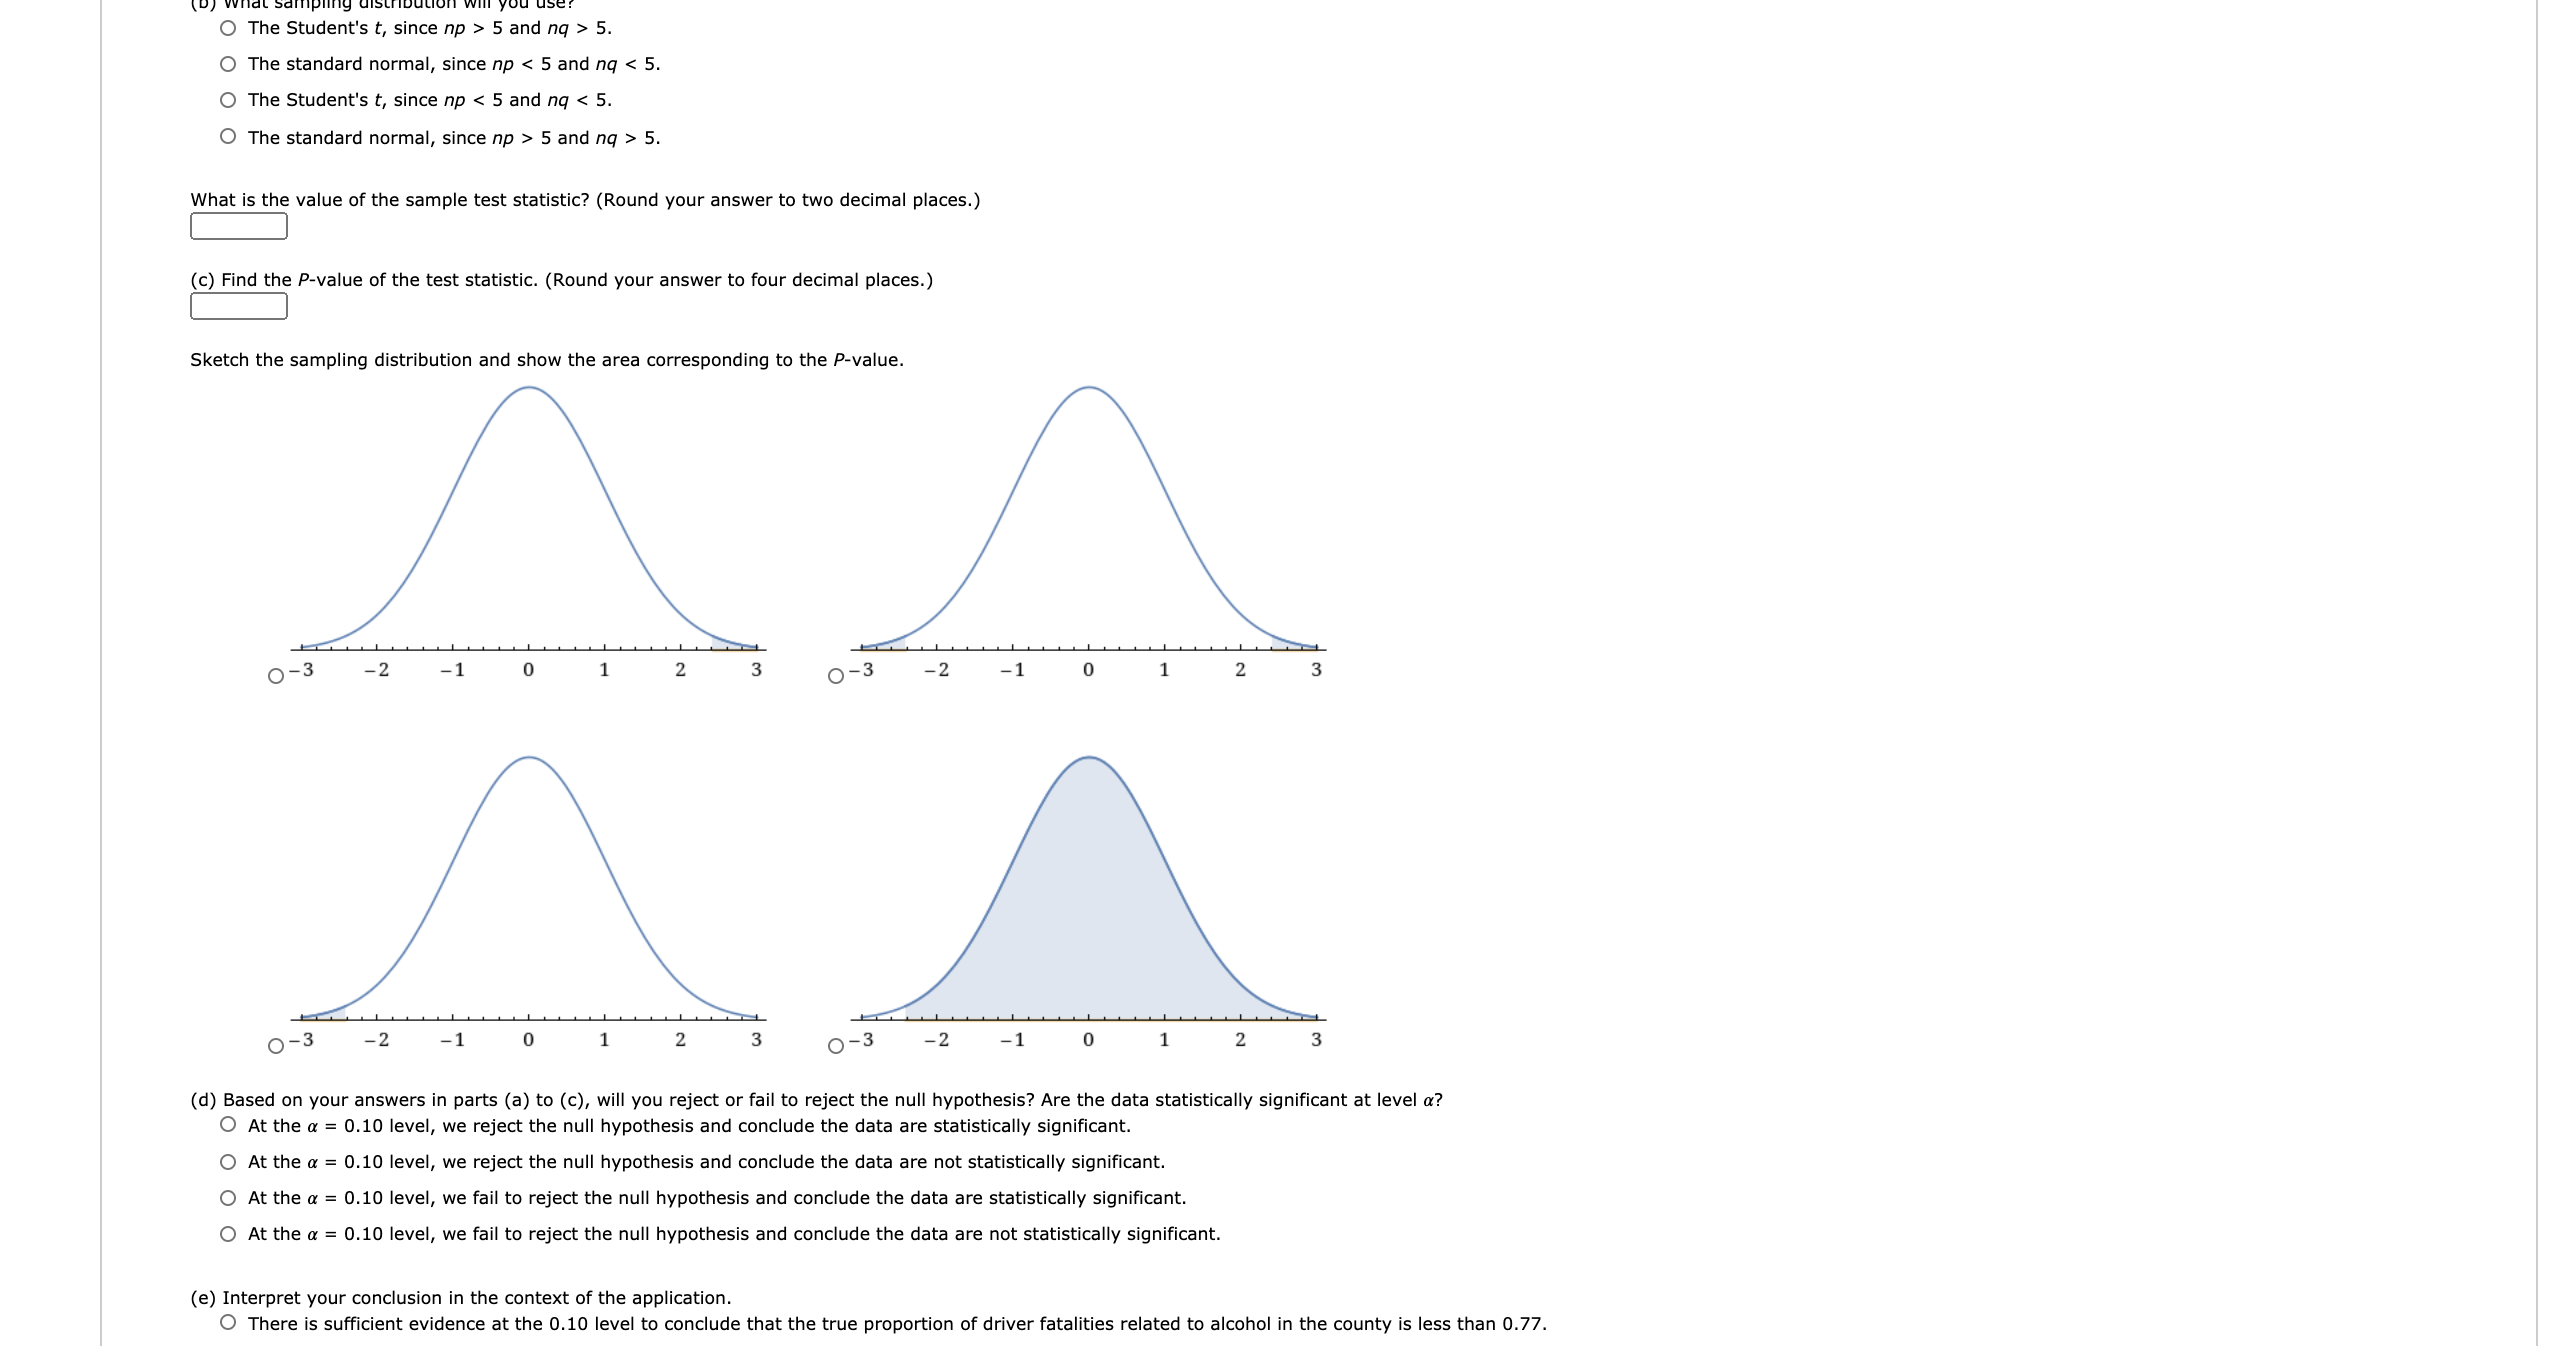
1. [-/1 Points] DETAILS BBBASICSTAT8 9.TB.002. MY NOTES The null hypothesis is the following. states that the treatment has no effect O is denoted by the symbol H1 O is always stated in terms of sample statistics O All of the other choices are correct. Need Help? Read it 2. [-/1 Points] DETAILS BBBASICSTAT8 9. TB.015. MY NOTES A Type II error is defined as the following. O rejecting a false null hypothesis O rejecting a true null hypothesis O failing to reject a false null hypothesis failing to reject a true null hypothesis Need Help? Read It 3. [-/1 Points] DETAILS BBBASICSTAT8 9.TB.019. MY NOTES A researcher risks a Type I error when doing the following. O anytime Ho is rejected O anytime H, is rejected O All of the other options are correct. O anytime the decision is "fail to reject Ho" Need Help? Read It4. [-/1 Points] DETAILS BBBASICSTAT8 9. TB.021. MY NOTES A researcher conducts a hypothesis test to evaluate the effect of a treatment. The hypothesis test produces a z-score of z = -2.60. Assuming that the researcher is using a two-tailed test, what is the correct statistical decision? O Reject the null hypothesis with a = .05 but not with a = 0.01. O Cannot answer without additional information. O Fail to reject the null hypothesis with either a = 0.05 or a = 0.01. O Reject the null hypothesis with either a = .05 or a = 0.01. Need Help? Read It 5. [-/1 Points] DETAILS BBBASICSTAT8 9. TB.037. MY NOTES If you fail to reject the null hypothesis, it means that the data do not provide sufficient evidence to say that the treatment has an effect. O True O False Need Help? Read It 6. [-/1 Points] DETAILS BBBASICSTAT8 9.TB.042. MY NOTES If a specific sample leads to rejecting the null hypothesis with a = .01, then the same sample would certainly lead to rejecting the null hypothesis if a were changed to .05. O True O False Need Help? Read It 7. [-/1 Points] DETAILS BBBASICSTAT8 9.TB.060. MY NOTES If a hypothesis test results in rejecting the null hypothesis, then the researcher must conclude that the treatment "does not have a significant effect." O True O False Need Help? Read Itusing iCloud. Not Now 8. [-/1 Points] DETAILS BBBASICSTAT8 9. TB.082. MY NOTES A researcher administers a treatment to a sample of n = 25 participants and uses a hypothesis test to evaluate the effect of the treatment. The hypothesis test produces a z-score of z = 2.77. Assuming that the researcher is using a two-tailed test, which of the following is true? O The researcher should fail to reject Ho with either a = .05 or a = .01. O Cannot answer without additional information. The researcher should reject the null hypothesis with either a = .05 or a = .01. The researcher rejects the null hypothesis with a = .05 but not with a = .01. Need Help? Read ItN oi N ow 9. [18 Polnts] BBBASICSTAT810.Z.013. - . . v. - A Michigan study concerning preference for outdoor activities used a questionnaire with a six-point Likert-type response in which 1 designated "not important" and 5 designated "extremely important" A random sample of n' = 52 adults were asked about fishing as an outdoor activity, The mean response was i, = 4.9. Another random sample of n2 = 47 adults were asked about camping as an outdoor activity. For this group, the mean response was ;2 = 4.3, From previous studies, it is known that :71 = 1.3 and a2 = 1.2. Note: A Likert scale usually has to do with approval of or agreement with a statement in a questionnaire, For example, respondents are asked to indicate whether they "strongly agree," \"agree," "disagree," or "strongly disagree" with the statement. (a) Do these data Indicate a difference (either way) regarding preference for camping versus preference for shan as an outdoor activity? Use a 5% level of significance (i) What is the level of signicance? State the null and alternate hypotheses. 0 Ho: #1 = #2; Hi: M > M2 0 Ho: I11 : #2; HI: #1 ' #2 0 Ho: ud W2; Hi: M: = M2 0 Ho: i\"! = #2; Hi: #1 0.47; H]: p = 0.47 0 Ha: p = 0.47; H): p > 0.47 (b) What sampling distribution will you use? 0 The standard normal, since np 5 and no > 5. o The standard nonnai, since np > 5 and M] > 5. what is the value of the sample test statistic? (Round your answer to two decimal places.) (c) Find the P-value of the test statistic. (Round your answer to four decimal places.) Sketch the sampling distribution and show the area corresponding to the Fvalue. The standard normal, since np > 5 and nq > 5. What is the value of the sample test statistic? (Round your answer to two decimal places.) (c) Find the P-value of the test statistic. (Round your answer to four decimal places.) Sketch the sampling distribution and show the area corresponding to the P-value. 0-3 -2 -1 0 1 2 O-3 -2 -1 0 1 2 0-3 -2 -1 0 2 0-3 -2 -1 2 (d) Based on your answers in parts (a) to (c), will you reject or fail to reject the null hypothesis? Are the data statistically significant at level a? At the a = 0.01 level, we reject the null hypothesis and conclude the data are statistically significant. O At the a = 0.01 level, we reject the null hypothesis and conclude the data are not statistically significant. O At the a = 0.01 level, we fail to reject the null hypothesis and conclude the data are statistically significant. O At the a = 0.01 level, we fail to reject the null hypothesis and conclude the data are not statistically significant. (e) Interpret your conclusion in the context of the application. There is sufficient evidence at the 0.01 level to conclude that the true proportion of customers loyal to Chevrolet is more than 0.47. O There is insufficient evidence at the 0.01 level to conclude that the true proportion of customers loyal to Chevrolet is more than 0.47.11. [-/4 Points] DETAILS BBBASICSTAT8 9.1.018.NVA MY NOTES PRACTICE ANOTHER A certain magazine stated that the mean time for a Ford Mustang to go from 0 to 60 miles per hour is 4.2 seconds. (a) If you want to set up a statistical test to challenge the claim of 4.2 seconds, what would you use for the null hypothesis? O H = 4.2 OH # 4.2 OH > 4.2 OH 4.2 O H # 4.2 (c) Suppose you made an engine modification and you think the average time to accelerate from 0 to 60 miles per hour is reduced. What would you use for the alternate hypothesis? O H 4.2 (d) For each of the tests in parts (b) and (c), would the P-value area be on the left, on the right, or on both sides of the mean? O both; left O right; left O left; right O left; both 12. [-/8 Points] DETAILS BBBASICSTAT8 10.R.007.NVA MY NOTES PRACTICE ANOTHER A study considered the question, "Are you a registered voter?" Accuracy of response was confirmed by a check of city voting records. Two methods of survey were used: a face-to-face interview and a telephone interview. A random sample of 92 people were asked the voter registration question face to face. Of those sampled, seventy-nine respondents gave accurate answers (as verified by city records). Another random sample of 84 people were asked the same question during a telephone interview. Of those sampled, seventy-five respondents gave accurate answers. Assume the samples are representative of the general population. (a) Let p1 be the population proportion of all people who answer the voter registration question accurately during a face-to-face interview. Let p2 be the population proportion of all people who answer the question accurately during a telephone interview. Find a 95% confidence interval for P1 - P2. (Round your answers to three decimal places.) lower limit upper limit(b) Does the interval contain numbers that are all positive? all negative? Comment on the meaning of the confidence interval in the context of this problem. At the 95% level, do you detect any difference in the proportion of accurate responses from face-to- face interviews compared with the proportion of accurate responses from telephone interviews? Because the interval contains only positive numbers, we can say that there is a higher proportion of accurate responses in face-to-face interviews. O Because the interval contains both positive and negative numbers, we can not say that there is a higher proportion of accurate responses in face-to-face interviews. We can not make any conclusions using this confidence interval. Because the interval contains only negative numbers, we can say that there is a higher proportion of accurate responses in telephone interviews. (c) Test the claim that there is a difference in the proportion of accurate responses from face-to-face interviews compared with telephone interviews. Use a = 0.05. (i) What is the level of significance? State the null and alternate hypotheses. O Ho: P1 = P2; H1: P1 # P2 O Ho: P1 = P2; H1: P1 P2 O Ho: P1 > P2; H1: P1 = P2 (ii) What sampling distribution will you use? What assumptions are you making? O The Student's t. We assume that both population distributions are approximately normal with known standard deviations. The Student's t. We assume that both population distributions are approximately normal with unknown standard deviations. The standard normal. We assume that both population distributions are approximately normal with unknown standard deviations. The standard normal. We assume that both population distributions are approximately normal with known standard deviations. What is the value of the sample test statistic? Compute the corresponding z or t value as appropriate. (Test the difference P1 - P2. Round your answer to two decimal places.) (iii) Find (or estimate) the P-value. (Round your answer to four decimal places.) Sketch the sampling distribution and show the area corresponding to the P-value. 0-3 -2 -1 0 1 2 0-3 -2 -1 0 1 20-3 -2 -1 0-3 -2 -1 2 (iv) Based on your answers to parts (i)-(iii), will you reject or fail to reject the null hypothesis? Are the data statistically significant at level a? O At the a = 0.05 level, we reject the null hypothesis and conclude the data are statistically significant. At the a = 0.05 level, we fail to reject the null hypothesis and conclude the data are not statistically significant. O At the a = 0.05 level, we reject the null hypothesis and conclude the data are not statistically significant. O At the a = 0.05 level, we fail to reject the null hypothesis and conclude the data are statistically significant. (v) Interpret your conclusion in the context of the application. O Reject the null hypothesis, there is sufficient evidence to suggest that the proportion of accurate responses from face-to-face interviews differs from the proportion for telephone interviews. O Reject the null hypothesis, there is insufficient evidence to suggest that the proportion of accurate responses from face-to-face interviews differs from the proportion for telephone interviews. O Fail to reject the null hypothesis, there is insufficient evidence to suggest that the proportion of accurate responses from face-to-face interviews differs from the proportion for telephone interviews. O Fail to reject the null hypothesis, there is sufficient evidence to suggest that the proportion of accurate responses from face-to-face interviews differs from the proportion for telephone interviews. 13. [-/8 Points] DETAILS BBBASICSTAT8 9.1.021. MY NOTES PRACTICE ANOTHER Bill Alther is a zoologist who studies Anna's hummingbird (Calypte anna). + Suppose that in a remote part of the Grand Canyon, a random sample of six of these birds was caught, weighed, and released. The weights (in grams) were as follows. 3.7 2.9 3.8 4.2 4.8 3.1 The sample mean is x = 3.75 grams. Let x be a random variable representing weights of hummingbirds in this part of the Grand Canyon. We assume that x has a normal distribution and o = 0.66 gram. Suppose it is known that for the population of all Anna's hummingbirds, the mean weight is u = 4.35 grams. Do the data indicate that the mean weight of these birds in this part of the Grand Canyon is less than 4.35 grams? Use a = 0.05. (a) What is the level of significance? State the null and alternate hypotheses. Will you use a left-tailed, right-tailed, or two-tailed test? O Ho: M = 4.35 g; H1: M > 4.35 g; right-tailed O Ho: M 0.77 0 Ha: = 0.77; 1-1,: p 5 and nq > 5. o The standard normal, since np 5 and M] > 5. what is the value of the sample test statistic? (Round your answer to two decimal places.) (c) Find the P-value of the test statistic. (Round your answer to four decimal places.) Sketch the sampling distribution and show the area corresponding to the Pvalue. The Student's t, since np > 5 and nq > 5. O The standard normal, since np 5 and nq > 5. What is the value of the sample test statistic? (Round your answer to two decimal places.) (c) Find the P-value of the test statistic. (Round your answer to four decimal places.) Sketch the sampling distribution and show the area corresponding to the P-value. 0-3 -2 -1 0 1 2 0-3 -2 -1 0 1 2 3 0-3 -2 O-3 -2 2 (d) Based on your answers in parts (a) to (c), will you reject or fail to reject the null hypothesis? Are the data statistically significant at level a? O At the a = 0.10 level, we reject the null hypothesis and conclude the data are statistically significant. O At the a = 0.10 level, we reject the null hypothesis and conclude the data are not statistically significant. O At the a = 0.10 level, we fail to reject the null hypothesis and conclude the data are statistically significant. O At the a = 0.10 level, we fail to reject the null hypothesis and conclude the data are not statistically significant. (e) Interpret your conclusion in the context of the application. There is sufficient evidence at the 0.10 level to conclude that the true proportion of driver fatalities related to alcohol in the county is less than 0.77
