solve the question
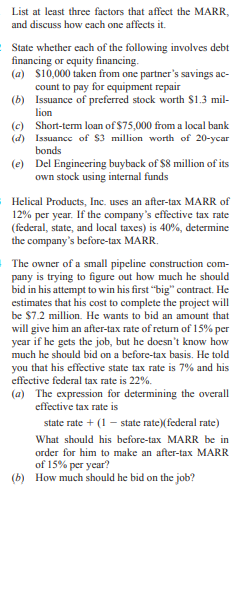
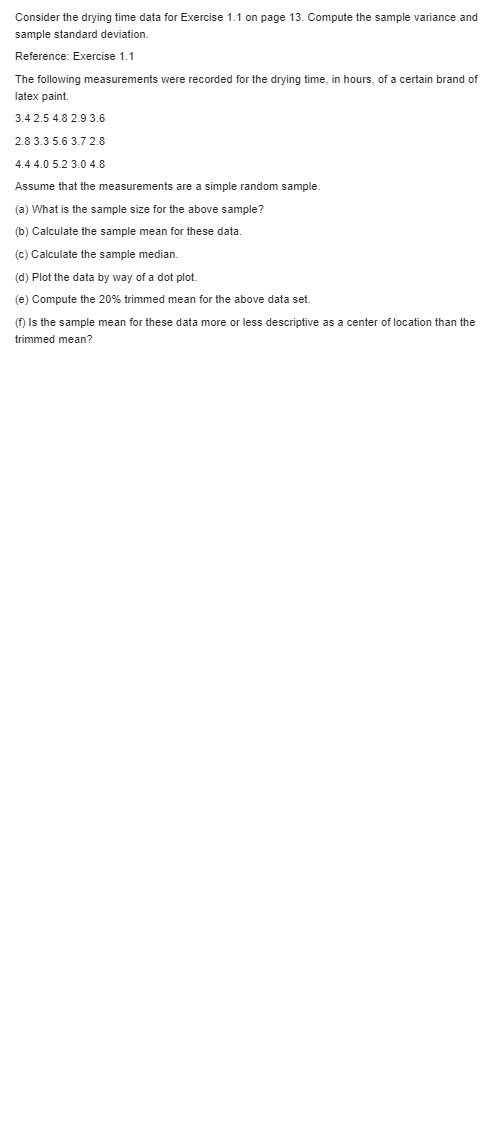
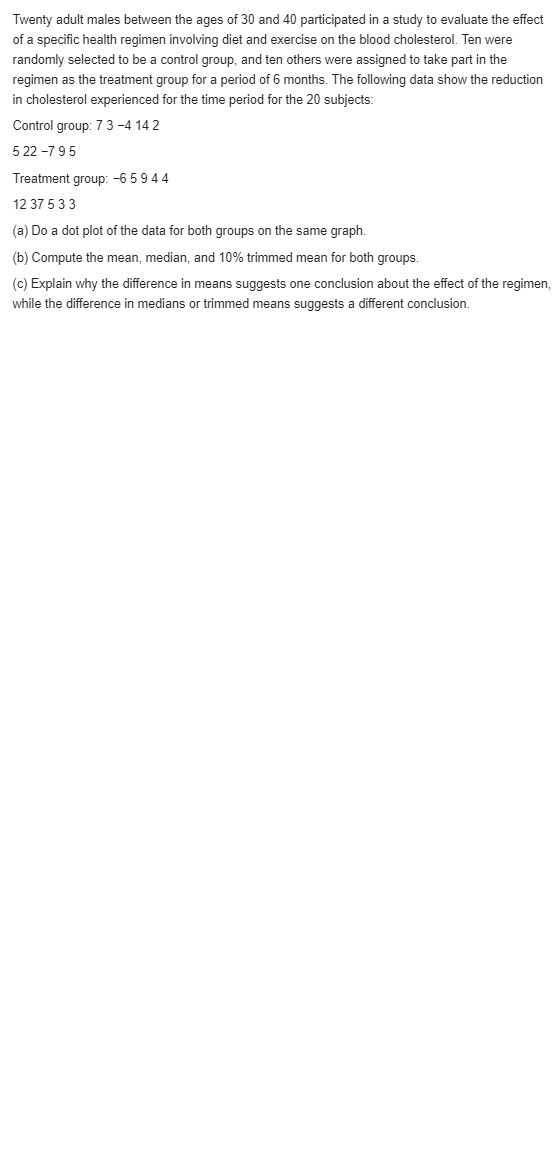
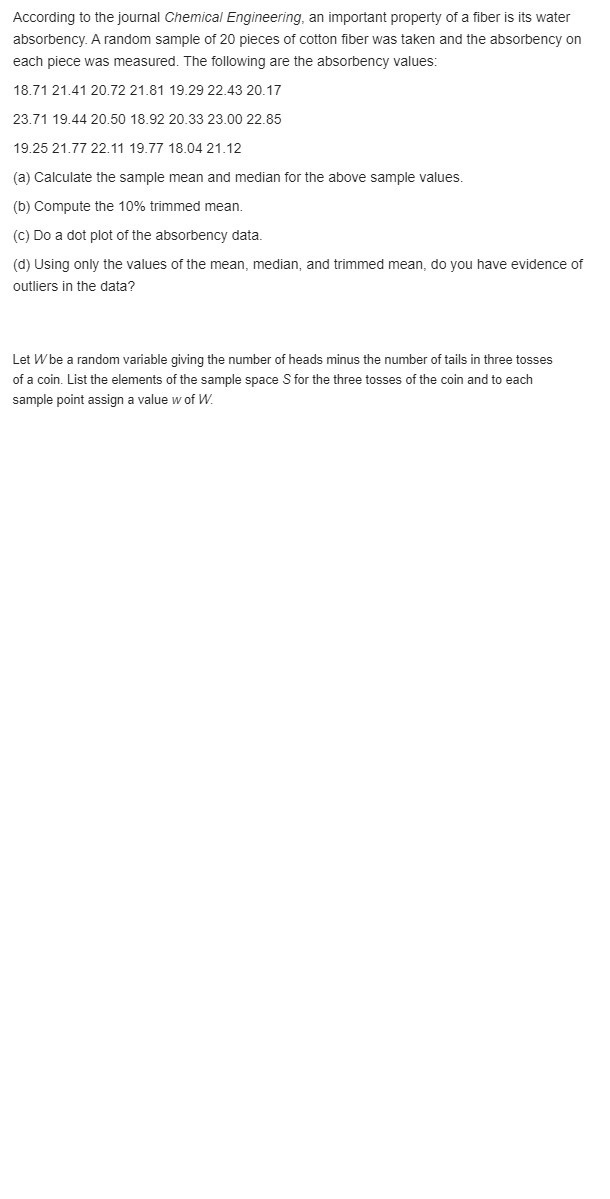
List at least three factors that affect the MARK, and discuss how each one affects it. State whether each of the following involves debt financing or equity financing. (a) $10,000 taken from one partner's savings ac- count to pay for equipment repair (b) Issuance of preferred stock worth $1.3 mil- lion (c) Short-term loan of $75,000 from a local bank (d) Issuance of $3 million worth of 20-year bonds (e) Del Engineering buyback of $8 million of its own stock using internal funds Helical Products, Inc. uses an after-tax MARR of 12% per year. If the company's effective tax rate (federal, state, and local taxes) is 40%, determine the company's before-tax MARK. The owner of a small pipeline construction com- pany is trying to figure out how much he should bid in his attempt to win his first "big" contract. He estimates that his cost to complete the project will be $7.2 million. He wants to bid an amount that will give him an after-tax rate of return of 15% per year if he gets the job, but he doesn't know how much he should bid on a before-tax basis. He told you that his effective state tax rate is 7% and his effective federal tax rate is 22%. (a) The expression for determining the overall effective tax rate is state rate + (1 - state rate)(federal rate) What should his before-tax MARR be in order for him to make an after-tax MARK of 15% per year? (b) How much should he bid on the job?Consider the drying time data for Exercise 1.1 on page 13. Compute the sample variance and sample standard deviation. Reference: Exercise 1.1 The following measurements were recorded for the drying tine. in hours. of a certain brand of latex pa'nt. 3.4 2.5 4.8 2.9 3.6 2.8 3.3 5.5 3.? 2.3 4.4 4.0 5.2 3.0 4.3 Assume that the measurements are a simple random sample. {a} What is the sample size for the above sample? {In} Calculate the sample mean for these data. {c} Calculate the sample median. {djl Plot the data by way of a dot plot. {e} Compute the 20% trirm'ned mean for the above data set. { Is the sample mean for these data more or less descriptive as a center of location than the trimmed mean? Twenty adult males between the ages of 30 and 40 participated in a study to evaluate the effect of a specific health regimen involving diet and exercise on the blood cholesterol. Ten were randomly selected to be a control group, and ten others were assigned to take part in the regimen as the treatment group for a period of 6 months. The following data show the reduction in cholesterol experienced for the time period for the 20 subjects: Control group: 7 3 -4 14 2 522 -795 Treatment group: -6 5 9 4 4 12 37 5 3 3 (a) Do a dot plot of the data for both groups on the same graph. (b) Compute the mean, median, and 10% trimmed mean for both groups. (c) Explain why the difference in means suggests one conclusion about the effect of the regimen while the difference in medians or trimmed means suggests a different conclusion.According to the journal Chemical Engineering, an important property of a fiber is its water absorbency. A random sample of 20 pieces of cotton fiber was taken and the absorbency on each piece was measured. The following are the absorbency values: 18.71 21.41 20.72 21.81 19.29 22.43 20.17 23.71 19.44 20.50 18.92 20.33 23.00 22.85 19.25 21.77 22.11 19.77 18.04 21.12 (a) Calculate the sample mean and median for the above sample values. (b) Compute the 10% trimmed mean. (c) Do a dot plot of the absorbency data. (d) Using only the values of the mean, median, and trimmed mean, do you have evidence of outliers in the data? Let Wbe a random variable giving the number of heads minus the number of tails in three tosses of a coin. List the elements of the sample space S for the three tosses of the coin and to each sample point assign a value w of W.The following measurements were recorded for the drying time, in hours, of a certain brand of latex paint. 3.4 2.5 4.8 2.9 3.6 2.8 3.3 5.6 3.7 2.8 4.4 4.0 5.2 3.0 4.8 Assume that the measurements are a simple random sample. (a) What is the sample size for the above sample? (b) Calculate the sample mean for these data. (c) Calculate the sample median. (d) Plot the data by way of a dot plot. (e) Compute the 20% trimmed mean for the above data set. (f) Is the sample mean for these data more or less descriptive as a center of location than the trimmed mean?WILL THE CORRECT ESL PLEASE STAND? Background Based on previous logbook data, the current estimates for number of operating hours per year are as follows: New pumper system equipment is under consideration by a Gulf Coast chemical processing plant. One crucial pump Year Hours per Year moves highly corrosive liquids from specially lined tanks on 500 intercoastal barges into storage and preliminary refining fa- 1500 cilities dockside. Because of the variable quality of the raw Q on 2000 chemical and the high pressures imposed on the pump chassis and impellers, a close log is maintained on the number of Case Study Questions hours per year that the pump operates. Safety records and pump component deterioration are considered critical control 1. Determine the economic service life of the pump. How points for this system. As currently planned, rebuild and does the ESL compare with the maximum allowed M&O cost estimates are increased accordingly when cumula- rebuilds? tive operating time reaches the 6000-hour mark. 2. The plant superintendent told you, the safety engineer, that only one rebuild should be planned for, because Information these types of pumps usually have their minimum-cost life before the second rebuild. Determine a market You are the safety engineer at the plant. Estimates made for value for this pump that will force the ESL to be 6 years. this pump are as follows: Comment on the practicality of ESL = 6 years, given First cost: $-800,000 the MV calculated. Rebuild cost: $-150,000 whenever 6000 cu- 3. In a separate conversation, the line manager told you mulative hours are logged. Each to not plan for a rebuild after 6000 hours, because rework will cost 20% more than the pump will be replaced after a total of 10,000 the previous one. A maximum of hours of operation. The line manager wants to know 3 rebuilds is allowed what the base AOC in year I can be to make the ESL 6 years. He also told you to assume now that the 15% M&O costs: $-25,000 for each year 1 through 4 growth rate applies from year I forward. How does $-40,000 per year starting the this base AOC value compare with the rebuild cost year after the first rebuild, plus after 6000 hours? 15% per year thereafter tat do you think of these suggestions from the plant MARK: 10% per year superintendent and the line manager?The proportion of people who respond to a certain mail-order solicitation is a continuous random variable X that has the density function f(x) = 2(3+2) 0
