

Answered step by step
Verified Expert Solution
Question
1 Approved Answer
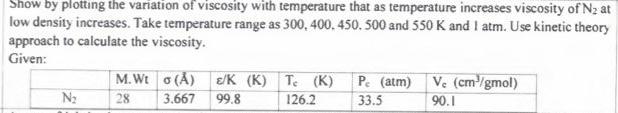
Show by plotting the variation of viscosity with temperature that as temperature increases viscosity of Na at low density increases. Take temperature range as 300,
Show by plotting the variation of viscosity with temperature that as temperature increases viscosity of Na at
low density increases. Take temperature range as 300, 400, 450. 500 and S50 K and 1 atm. Use kinetic theory
approach to calculate the viscosity.
Given:
Step by Step Solution
There are 3 Steps involved in it
Step: 1

Get Instant Access to Expert-Tailored Solutions
See step-by-step solutions with expert insights and AI powered tools for academic success
Step: 2

Step: 3
Ace Your Homework with AI
Get the answers you need in no time with our AI-driven, step-by-step assistance
Get Started
Elements Of Chemical Reaction Engineering
Authors: H. Scott Fogler
4th Edition
0130473944, 978-0130473943