please help me with matlap assighment i need page 3 problem 4 only #3&4
thanks
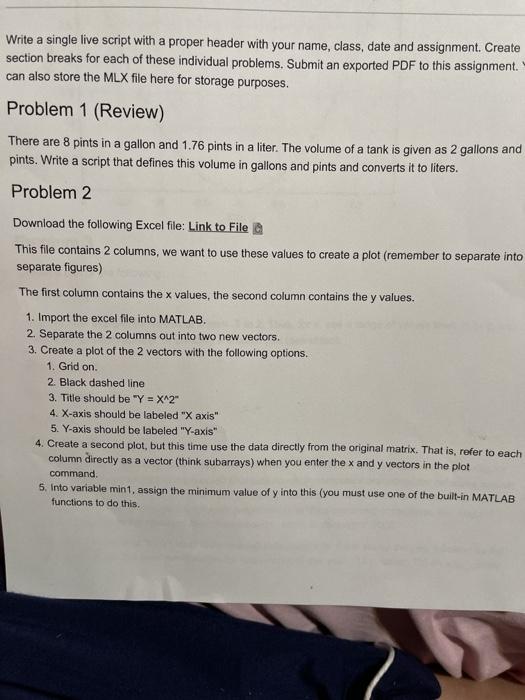
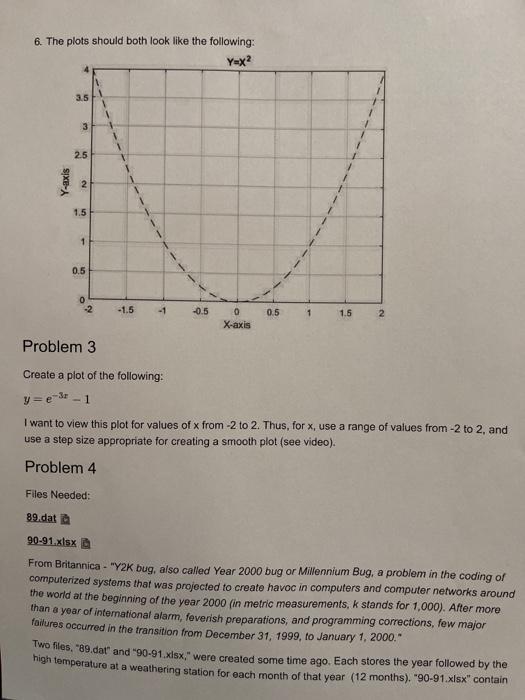
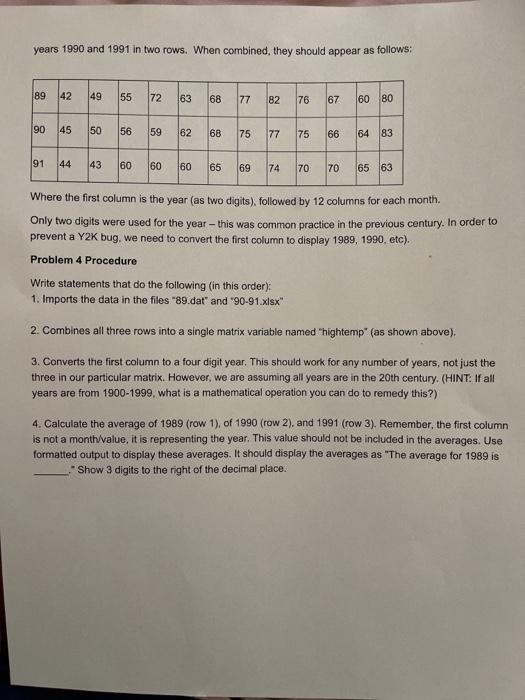
Write a single live script with a proper header with your name, class, date and assignment. Create section breaks for each of these individual problems. Submit an exported PDF to this assignment. can also store the MLX file here for storage purposes. Problem 1 (Review) There are 8 pints in a gallon and 1.76 pints in a liter. The volume of a tank is given as 2 gallons and pints. Write a script that defines this volume in gallons and pints and converts it to liters. Problem 2 Download the following Excel file: Link to File This file contains 2 columns, we want to use these values to create a plot (remember to separate into separate figures) The first column contains the x values, the second column contains the y values. 1. Import the excel file into MATLAB 2. Separate the 2 columns out into two new vectors. 3. Create a plot of the 2 vectors with the following options. 1. Grid on. 2. Black dashed line 3. Title should be "Y = X^2" 4. X-axis should be labeled "X axis" 5. Y-axis should be labeled "Y-axis" 4. Create a second plot, but this time use the data directly from the original matrix. That is, refer to each column directly as a vector (think subarrays) when you enter the x and y vectors in the plot command 5. Into variable mint, assign the minimum value of y into this (you must use one of the built-in MATLAB functions to do this. 6. The plots should both look like the following: Y=x? 3.5 3 1 1 1 2.5 Y-axis 2 1.5 1 0.5 0 -2 -1.5 -1 -0.5 0.5 1 1.5 2 0 X-axis Problem 3 Create a plot of the following: y=e -Sr - 1 I want to view this plot for values of x from -2 to 2. Thus, for X, use a range of values from -2 to 2. and use a step size appropriate for creating a smooth plot (see video). Problem 4 Files Needed: 89.dat 90-91.xlsx From Britannica - "Y2K bug, also called Year 2000 bug or Millennium Bug, a problem in the coding of computerized systems that was projected to create havoc in computers and computer networks around the world at the beginning of the year 2000 (in metric measurements, k stands for 1,000). After more than a year of international alarm, feverish preparations, and programming corrections, few major failures occurred in the transition from December 31, 1999, to January 1, 2000. Two files. "89.dat" and "90-91.xlsx, were created some time ago. Each stores the year followed by the high temperature at a weathering station for each month of that year (12 months). -90-91.xlsx" contain years 1990 and 1991 in two rows. When combined, they should appear as follows: 89 42 49 55 72 63 68 77 82 76 67 60 80 90 45 50 56 59 62 68 75 77 75 66 64 83 91 44 43 60 60 60 65 69 74 70 70 65 63 Where the first column is the year (as two digits), followed by 12 columns for each month. Only two digits were used for the year - this was common practice in the previous century. In order to prevent a Y2K bug, we need to convert the first column to display 1989, 1990, etc). Problem 4 Procedure Write statements that do the following (in this order) 1. Imports the data in the files "89.dat" and "90-91.xlsx" 2. Combines all three rows into a single matrix variable named "hightemp" (as shown above), 3. Converts the first column to a four digit year. This should work for any number of years, not just the three in our particular matrix. However, we are assuming all years are in the 20th century. (HINT: If all years are from 1900-1999, what is a mathematical operation you can do to remedy this?) 4. Calculate the average of 1989 (row 1), of 1990 (row 2). and 1991 (row 3). Remember, the first column is not a month/value, it is representing the year. This value should not be included in the averages. Use formatted output to display these averages. It should display the averages as "The average for 1989 is * Show 3 digits to the right of the decimal place. Write a single live script with a proper header with your name, class, date and assignment. Create section breaks for each of these individual problems. Submit an exported PDF to this assignment. can also store the MLX file here for storage purposes. Problem 1 (Review) There are 8 pints in a gallon and 1.76 pints in a liter. The volume of a tank is given as 2 gallons and pints. Write a script that defines this volume in gallons and pints and converts it to liters. Problem 2 Download the following Excel file: Link to File This file contains 2 columns, we want to use these values to create a plot (remember to separate into separate figures) The first column contains the x values, the second column contains the y values. 1. Import the excel file into MATLAB 2. Separate the 2 columns out into two new vectors. 3. Create a plot of the 2 vectors with the following options. 1. Grid on. 2. Black dashed line 3. Title should be "Y = X^2" 4. X-axis should be labeled "X axis" 5. Y-axis should be labeled "Y-axis" 4. Create a second plot, but this time use the data directly from the original matrix. That is, refer to each column directly as a vector (think subarrays) when you enter the x and y vectors in the plot command 5. Into variable mint, assign the minimum value of y into this (you must use one of the built-in MATLAB functions to do this. 6. The plots should both look like the following: Y=x? 3.5 3 1 1 1 2.5 Y-axis 2 1.5 1 0.5 0 -2 -1.5 -1 -0.5 0.5 1 1.5 2 0 X-axis Problem 3 Create a plot of the following: y=e -Sr - 1 I want to view this plot for values of x from -2 to 2. Thus, for X, use a range of values from -2 to 2. and use a step size appropriate for creating a smooth plot (see video). Problem 4 Files Needed: 89.dat 90-91.xlsx From Britannica - "Y2K bug, also called Year 2000 bug or Millennium Bug, a problem in the coding of computerized systems that was projected to create havoc in computers and computer networks around the world at the beginning of the year 2000 (in metric measurements, k stands for 1,000). After more than a year of international alarm, feverish preparations, and programming corrections, few major failures occurred in the transition from December 31, 1999, to January 1, 2000. Two files. "89.dat" and "90-91.xlsx, were created some time ago. Each stores the year followed by the high temperature at a weathering station for each month of that year (12 months). -90-91.xlsx" contain years 1990 and 1991 in two rows. When combined, they should appear as follows: 89 42 49 55 72 63 68 77 82 76 67 60 80 90 45 50 56 59 62 68 75 77 75 66 64 83 91 44 43 60 60 60 65 69 74 70 70 65 63 Where the first column is the year (as two digits), followed by 12 columns for each month. Only two digits were used for the year - this was common practice in the previous century. In order to prevent a Y2K bug, we need to convert the first column to display 1989, 1990, etc). Problem 4 Procedure Write statements that do the following (in this order) 1. Imports the data in the files "89.dat" and "90-91.xlsx" 2. Combines all three rows into a single matrix variable named "hightemp" (as shown above), 3. Converts the first column to a four digit year. This should work for any number of years, not just the three in our particular matrix. However, we are assuming all years are in the 20th century. (HINT: If all years are from 1900-1999, what is a mathematical operation you can do to remedy this?) 4. Calculate the average of 1989 (row 1), of 1990 (row 2). and 1991 (row 3). Remember, the first column is not a month/value, it is representing the year. This value should not be included in the averages. Use formatted output to display these averages. It should display the averages as "The average for 1989 is * Show 3 digits to the right of the decimal place