

Question
Please help me with my assignment! Determine the following information for the selected poll results and include in your paper. State the poll question, the
Please help me with my assignment!
Determine the following information for the selected poll results and include in your paper.
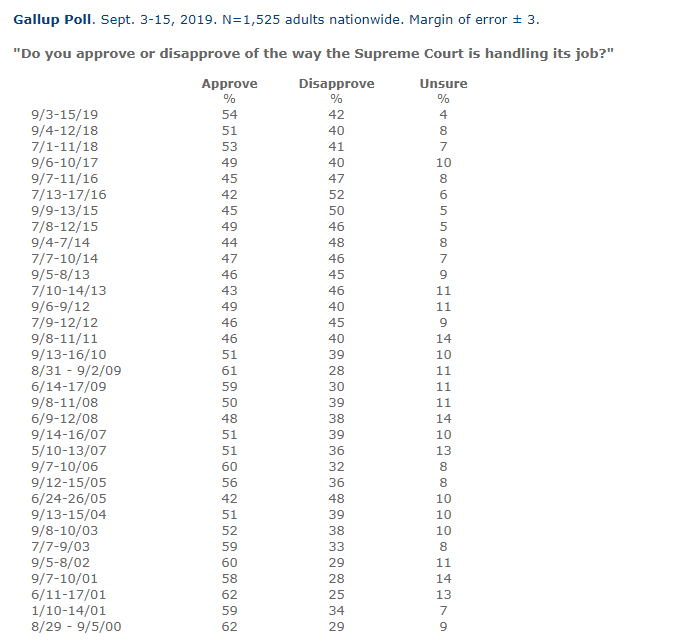
State the poll question, the sample sizen, and the margin of error (also known as sampling error).
Show work and explain the process for determining the solution for each of these problems on a word document with the solution given below the problem.
If Excel was used, please indicate that as well on the word document.
A word document and/or the Excel Workbook (if used) should be submitted to the Dropbox with labels on the worksheets to indicate which problem is being evaluated.
All answers should be clearly indicated.
1.Calculate confidence interval estimates for the proportion
2.State the confidence interval using the MoE. What does this confidence interval estimate?
3.Use the Confidence Interval template (found in this module'sLiveBinder) to calculate the confidence interval based on the sample size and the number of successes (the proportion you are interested in). Use a confidence level of 95%.
4.What is the calculated confidence interval? How does this compare to the interval in part a using the poll's margin of error?
5.Compute sample size needed for the confidence interval of the proportion.
6.Calculate the sample size needed for the given margin of error and see if the poll had enough people surveyed. Use the sample size template (found in this module'sLiveBinder) to find the sample size needed.
7.Describe hypothesis testing to test a population proportion
8.Suppose that you do not believe that the poll is accurate.You are to develope a hypothesis test to determine the validity of the poll testing its proportion.
9.Describe what you feel the proportion should be (greater than, less than, or not equal to) in comparison to the proportion given.
10.Write null hypothesis for the test.
11.Write the alternate hypothesis for the test.
12.Determine an appropriate level of significance for the test.
13.Testing a Hypothesis about a Population proportion.
14.Suppose that you conduct a study on your situation in which the sample statistic produces a test statistic of 2.13.
15.Based upon your level of significance from 3 part 4, would you reject or fail to reject the null hypothesis?Explain your decision.
16.Determine a level of significance that would have the opposite result of 4 a part i.Explain why this level of significance would have the opposite result.
Step by Step Solution
There are 3 Steps involved in it
Step: 1

Get Instant Access to Expert-Tailored Solutions
See step-by-step solutions with expert insights and AI powered tools for academic success
Step: 2

Step: 3
Ace Your Homework with AI
Get the answers you need in no time with our AI-driven, step-by-step assistance
Get Started
Essentials of Business Analytics
Authors: Jeffrey D. Camm, James J. Cochran, Michael J. Fry, Jeffrey W. Ohlmann, David R. Anderson
2nd edition
1305627733, 978-1305861817, 1305861817, 978-0357688960, 978-1305627734