PLEASE HELP ME WITH MY MATHS WORK. PLEASE Dont*Do #29, Only*Do #30 and the other ones. Thank you ?
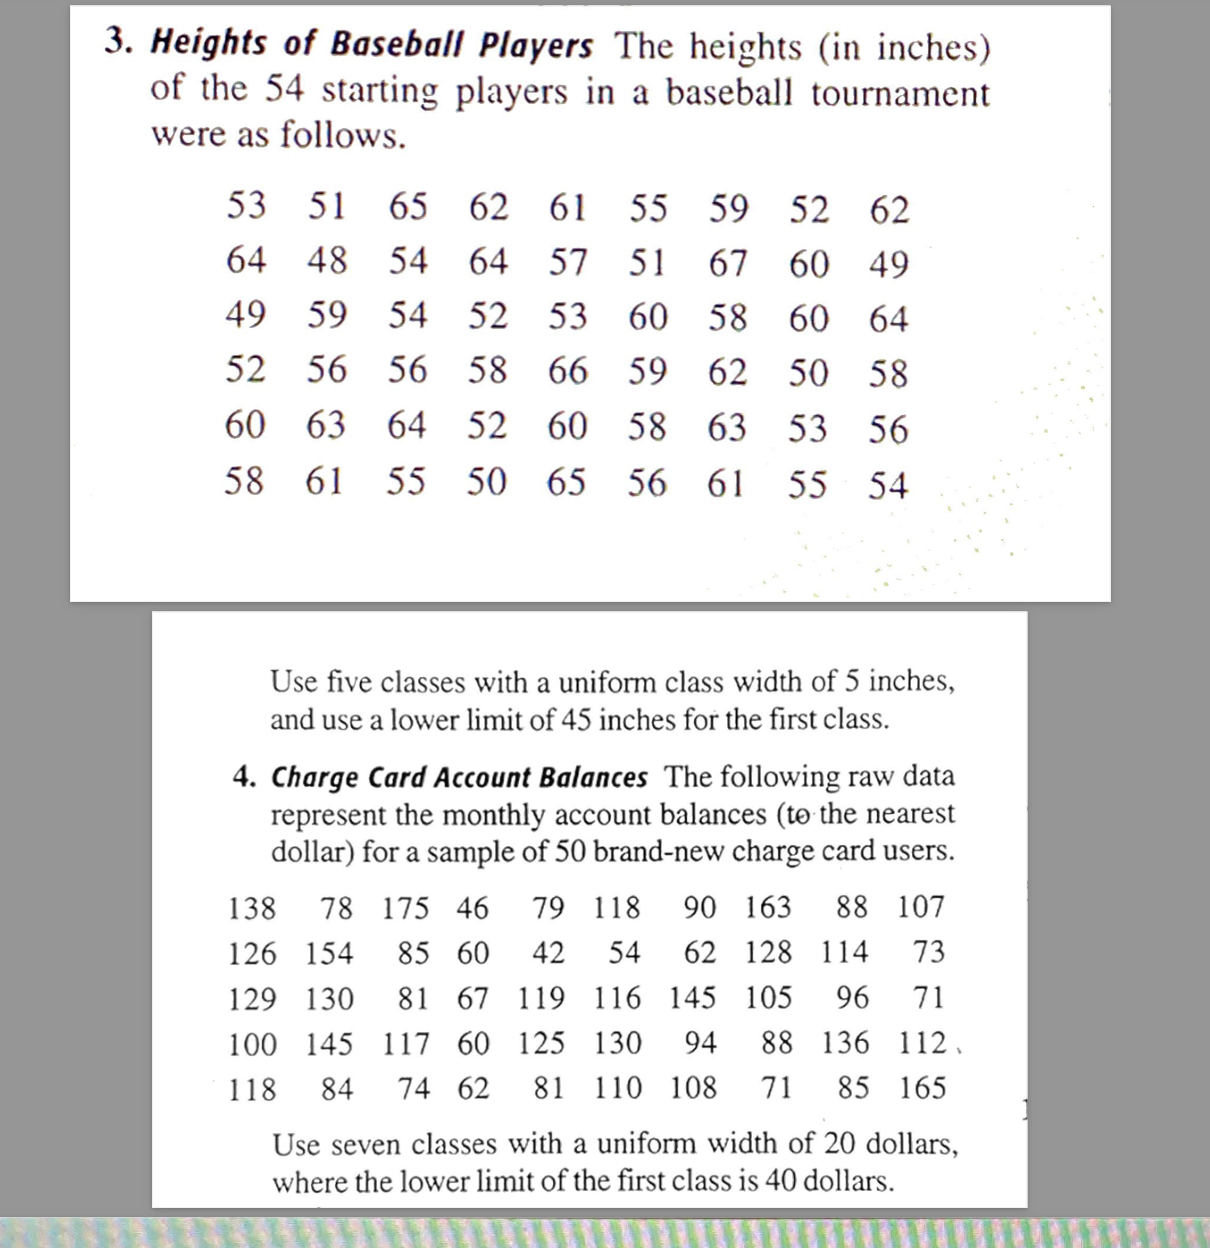
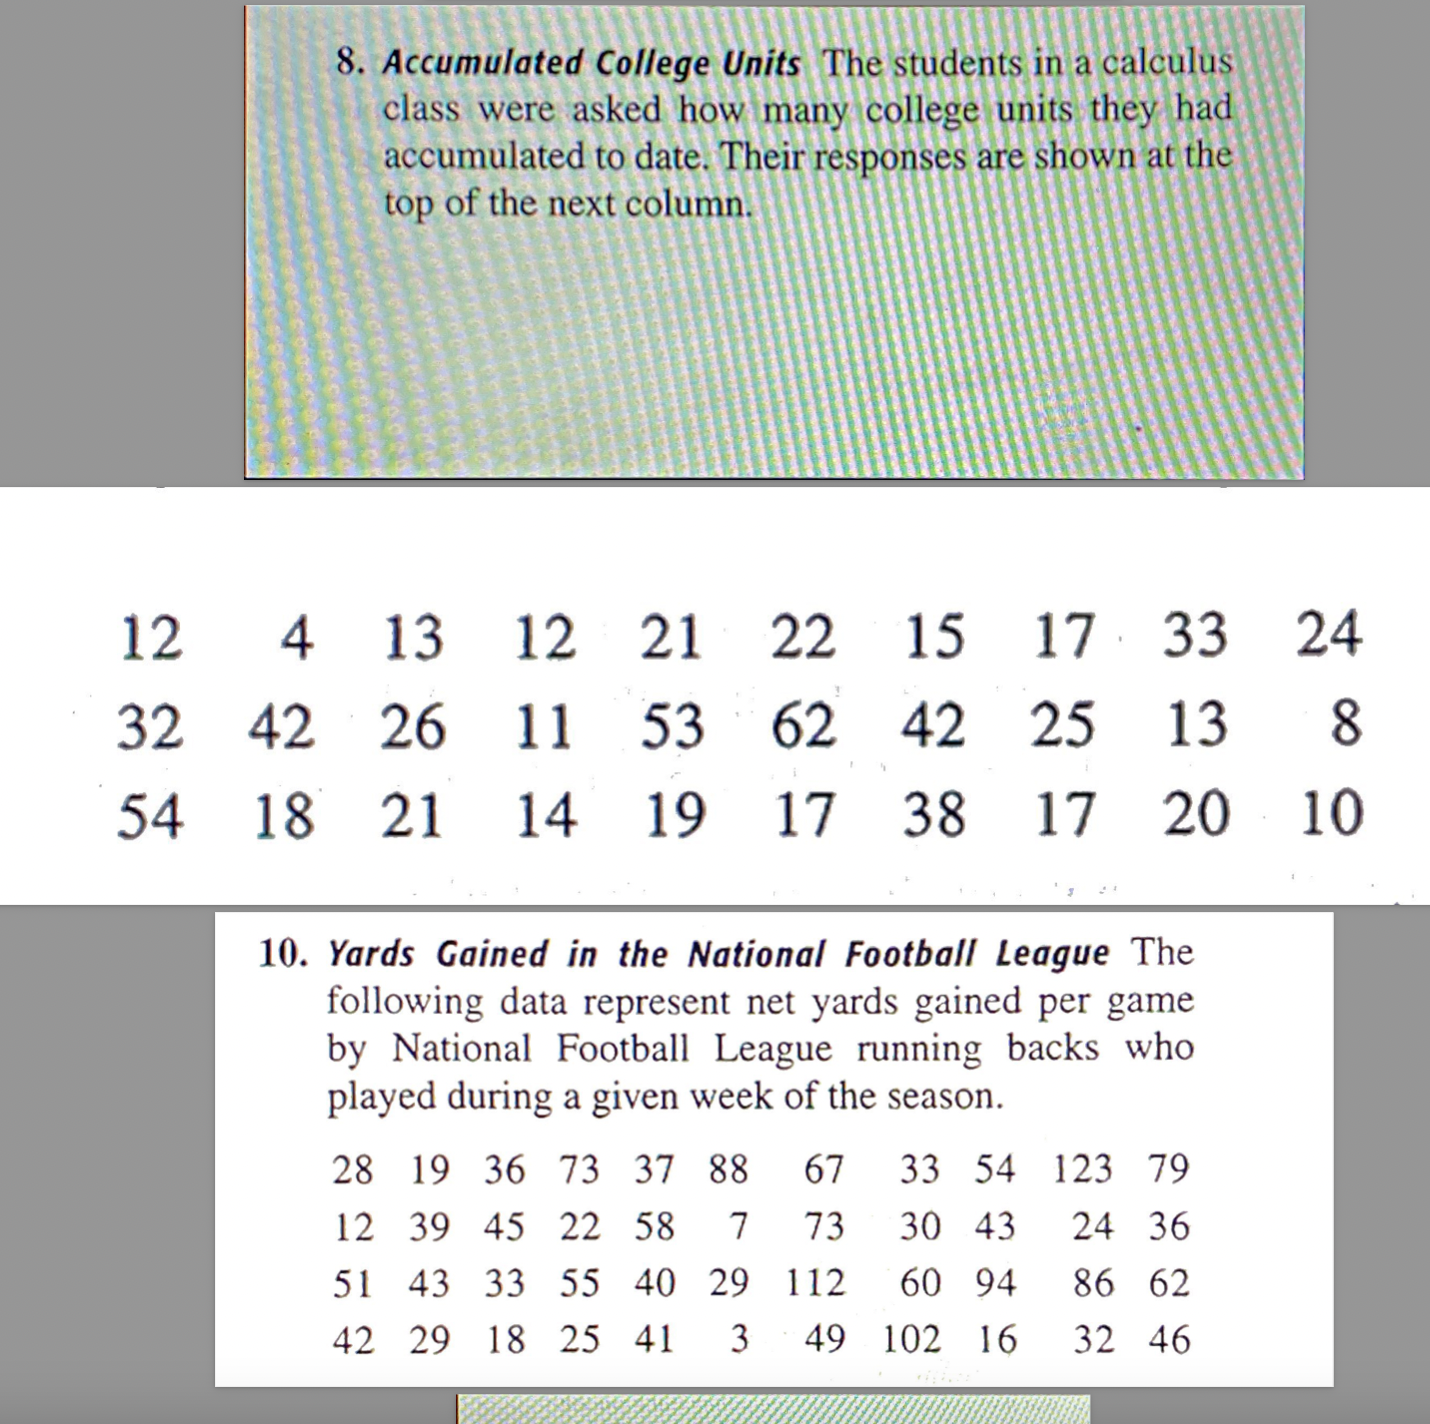
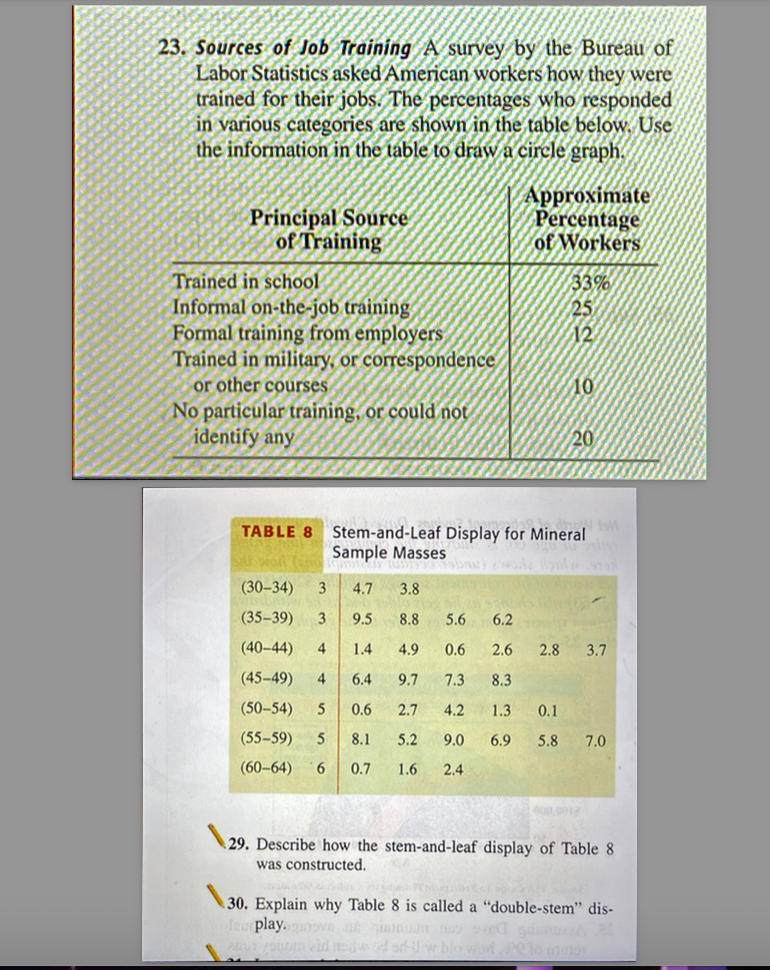
3. Heights of Baseball Players The heights (in inches) of the 54 starting players in a baseball tournament were as follows. 53 51 65 62 61 55 59 52 62 64 48 54 64 57 51 67 60 49 49 59 54 52 53 60 58 60 64 52 56 56 58 66 59 62 50 58 60 63 64 52 60 58 63 53 56 58 61 55 50 65 56 61 55 54 Use five classes with a uniform class width of 5 inches, and use a lower limit of 45 inches for the first class. 4. Charge Card Account Balances The following raw data represent the monthly account balances (to the nearest dollar) for a sample of 50 brand-new charge card users. 138 78 175 46 79 118 90 163 88 107 126 154 85 60 42 54 62 128 114 73 129 130 81 67 119 116 145 105 96 71 100 145 117 60 125 130 94 88 136 112 118 84 74 62 81 110 108 71 85 165 Use seven classes with a uniform width of 20 dollars, where the lower limit of the first class is 40 dollars.8. Accumulated College Units The students in a calculus class were asked how many college units they had accumulated to date. Their responses are shown at the top of the next column. 12 4 13 12 21 22 15 17 33 24 32 42 26 11 53 62 42 25 13 8 54 18 21 14 19 17 38 17 20 10 10. Yards Gained in the National Football League The following data represent net yards gained per game by National Football League running backs who played during a given week of the season. 28 19 36 73 37 88 67 33 54 123 79 12 39 45 22 58 7 73 30 43 24 36 51 43 33 55 40 29 112 60 94 86 62 42 29 18 25 41 3 49 102 16 32 4623. Sources of Job Training A survey by the Bureau of Labor Statistics asked American workers how they were trained for their jobs. The percentages who responded in various categories are shown in the table below. Use the information in the table to draw a circle graph. Approximate Principal Source Percentage of Training of Workers Trained in school 33% Informal on-the-job training 25 Formal training from employers 12 Trained in military, or correspondence or other courses 10 No particular training, or could not identify any 20 TABLE 8 Stem-and-Leaf Display for Mineral Sample Masses (30-34) 3 4.7 3.8 (35-39) 3 9.5 8.8 5.6 6.2 (40-44) 4 1.4 4.9 0.6 2.6 2.8 3.7 (45-49) 4 6.4 9.7 7.3 8.3 (50-54) 5 0.6 2.7 4.2 1.3 0.1 (55-59) 5 8.1 5.2 9.0 6.9 5.8 7.0 (60-64) 6 0.7 1.6 2.4 29. Describe how the stem-and-leaf display of Table 8 was constructed. 30. Explain why Table 8 is called a "double-stem" dis- Igo play. grapes and hismum Mayoto end nedwed shallow blo word , Pe to must


