please help me with python
this is test5.py
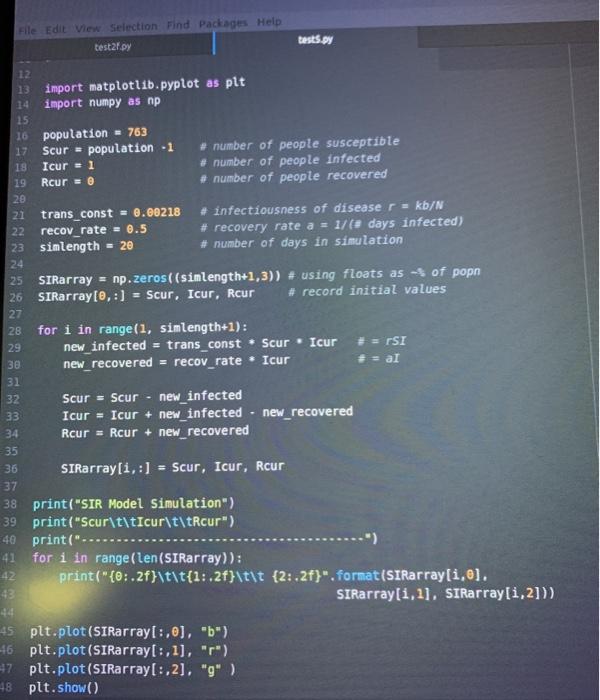
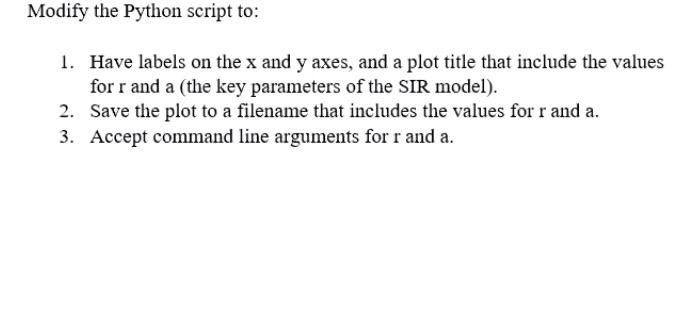
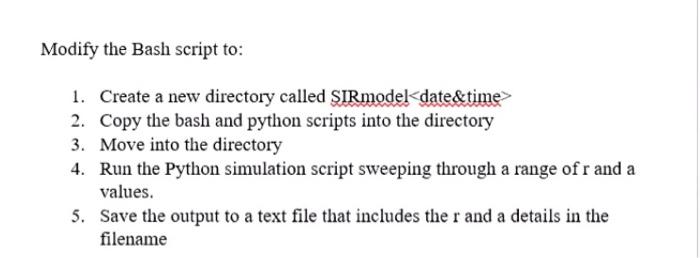
Modify the Bash script to: 1. Create a new directory called SIRmodel date&time> 2. Copy the bash and python scripts into the directory 3. Move into the directory 4. Run the Python simulation script sweeping through a range of r and a values. 5. Save the output to a text file that includes the r and a details in the filename Modify the Python script to: 1. Have labels on the x and y axes, and a plot title that include the values for r and a (the key parameters of the SIR model). 2. Save the plot to a filename that includes the values for r and a. 3. Accept command line arguments for r and a. File Edit View Selection Find Packages Help test27.py tests.py 12 13 import matplotlib.pyplot as plt 14 import numpy as np 25 16 population = 763 17 Scur = population -1 # number of people susceptible 18 Icur = 1 # number of people infected 19 Rcur = # number of people recovered 20 21 trans_const = 0.00218 # infectiousness of disease r = kb/N 22 recov_rate - 0.5 # recovery rate a = 1/(8 days infected) 23 simlength = 20 # number of days in simulation 24 25 SIRrray = np.zeros((simlength+1,3)) # using floats as - of popn 26 SIRarray(e, :) = Scur, Icur, Rcur # record initial values 27 28 for i in range(1, simlength+1): 29 new_infected = trans_const * Scur . Icur # = TSI 30 new_recovered = recov_rate Icur + = al 31 32 33 34 Scur = Scur - new_infected Icur = Icur + new_infected .new_recovered Rcur = Rcur + new_recovered 35 36 SIRrray[i,:] = Scur, Icur, Rcur 37 38 print("SIR Model Simulation") 39 print("Scur\t\tIcur\t\tRcur") 40 print("...... 41 for i in range(len (SIRrray)): 42 print("{0:.2f}\t\t{1:.2f}\t\t {2:.2f}" format(SIRrray[i,0). 43 SIRarray(1, 1), SIRrray[1,2])) 44 45 plt.plot(SIRrray[:,0), "b") 46 plt.plot(SIRrray[:,1), "r") 47 plt.plot(SIRrray[:,2], "9" ) 48 plt.show() Modify the Bash script to: 1. Create a new directory called SIRmodel date&time> 2. Copy the bash and python scripts into the directory 3. Move into the directory 4. Run the Python simulation script sweeping through a range of r and a values. 5. Save the output to a text file that includes the r and a details in the filename Modify the Python script to: 1. Have labels on the x and y axes, and a plot title that include the values for r and a (the key parameters of the SIR model). 2. Save the plot to a filename that includes the values for r and a. 3. Accept command line arguments for r and a. File Edit View Selection Find Packages Help test27.py tests.py 12 13 import matplotlib.pyplot as plt 14 import numpy as np 25 16 population = 763 17 Scur = population -1 # number of people susceptible 18 Icur = 1 # number of people infected 19 Rcur = # number of people recovered 20 21 trans_const = 0.00218 # infectiousness of disease r = kb/N 22 recov_rate - 0.5 # recovery rate a = 1/(8 days infected) 23 simlength = 20 # number of days in simulation 24 25 SIRrray = np.zeros((simlength+1,3)) # using floats as - of popn 26 SIRarray(e, :) = Scur, Icur, Rcur # record initial values 27 28 for i in range(1, simlength+1): 29 new_infected = trans_const * Scur . Icur # = TSI 30 new_recovered = recov_rate Icur + = al 31 32 33 34 Scur = Scur - new_infected Icur = Icur + new_infected .new_recovered Rcur = Rcur + new_recovered 35 36 SIRrray[i,:] = Scur, Icur, Rcur 37 38 print("SIR Model Simulation") 39 print("Scur\t\tIcur\t\tRcur") 40 print("...... 41 for i in range(len (SIRrray)): 42 print("{0:.2f}\t\t{1:.2f}\t\t {2:.2f}" format(SIRrray[i,0). 43 SIRarray(1, 1), SIRrray[1,2])) 44 45 plt.plot(SIRrray[:,0), "b") 46 plt.plot(SIRrray[:,1), "r") 47 plt.plot(SIRrray[:,2], "9" ) 48 plt.show()