Please help me with Requirement 1.
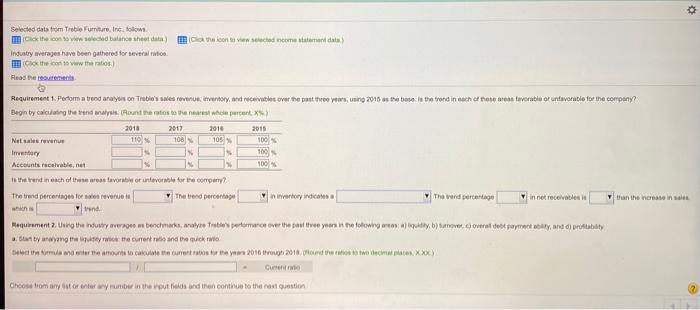
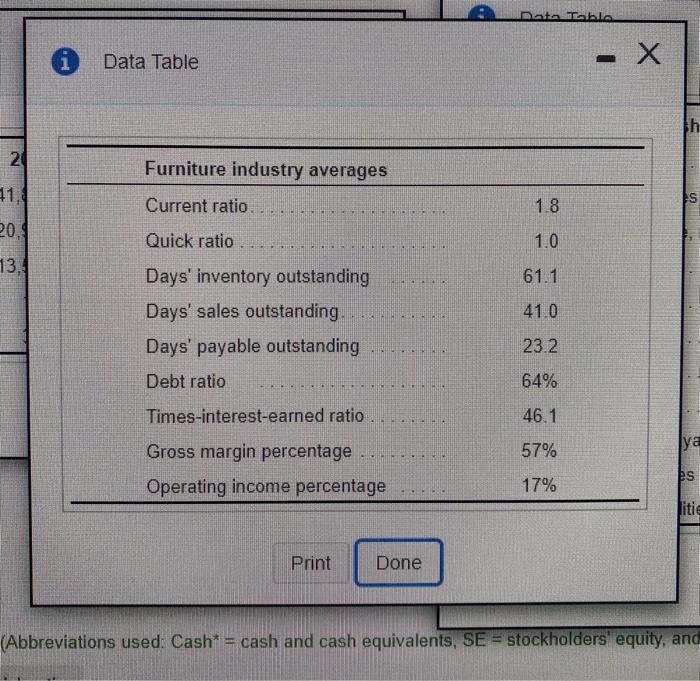
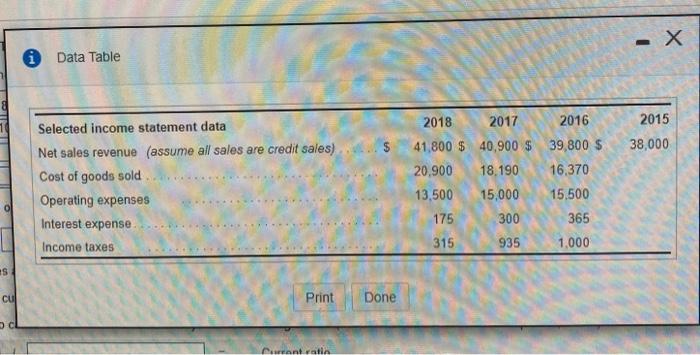
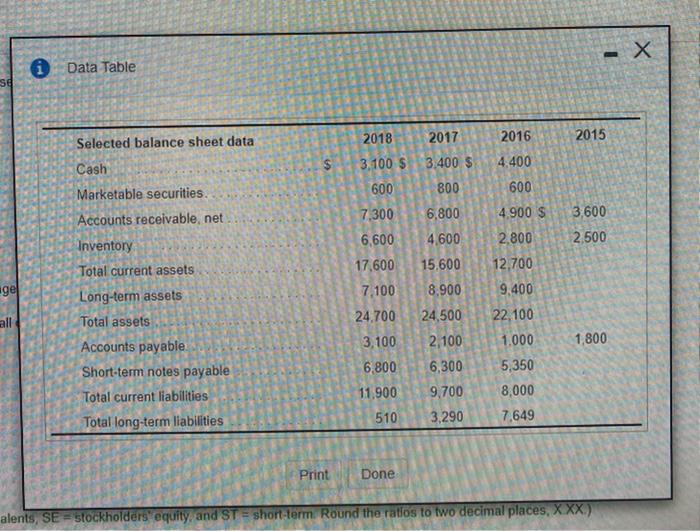
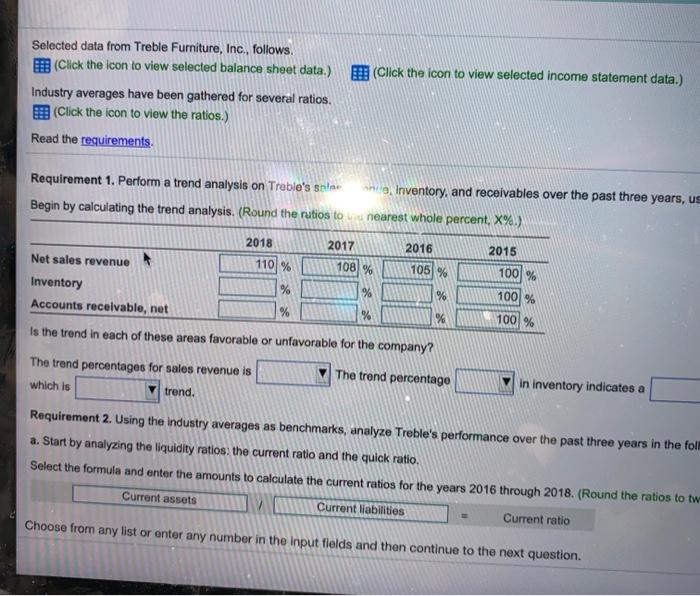
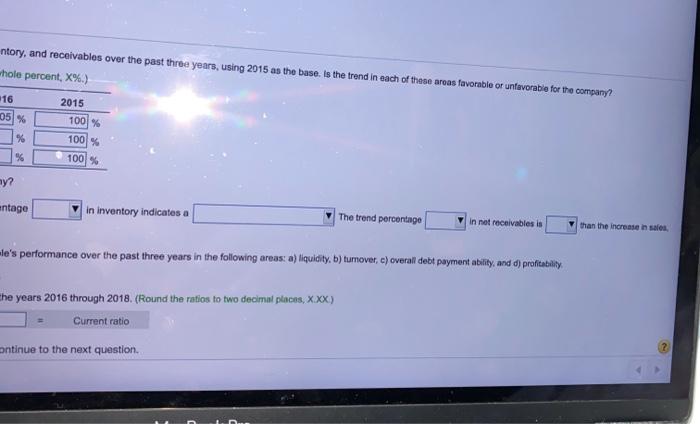
Geloon wednom trend data) Selected data from Trebio Furniture, in folo Cathe.com ww selected balance sheet data Industry everages have been gathered for several tito the contowwhts) 2018 Requirement 1. Perform a trend anayor Trebis sales revenus inventory, and receivables over the past year's ning 2016 as the base in the ordination areas favorable or unfavorable for the company? Begin by calculating the end sound entstehen 2017 2016 2018 Nelserne 110 108 105 100 Investory 100 Accounts receivable, et 100 in the trend neach areas favorable or nevoile for company The trend percentage to even te The trend percentage Inventory indica innet received than the neasines trend Mequirement 2. Using the industry or benchmarks, analyze the performance over the past three years in the following ready b) Sumower, cover de paymenty, and di profitability art by nong the service the current ratio and the quick revio temama olur ve anoorte to emertoe bete your 2016, 2018, condotto decina par XXX Cure Choose from any storey und in the outs and then continue to the rest oston Data Table - th 2 Furniture industry averages 11. Current ratio... S 1.8 200 Quick ratio 1.0 SER 13. 61.1 41.0 Days' inventory outstanding Days' sales outstanding. Days' payable outstanding Debt ratio 23.2 64% HHH Times-interest-earned ratio 46.1 57% jya Gross margin percentage Operating income percentage es 17% Print Done (Abbreviations used: Cash* = cash and cash equivalents, SE = stockholders equity, and - X i Data Table 2015 $ 38,000 Selected income statement data Net sales revenue (assume all sales are credit sales) Cost of goods sold Operating expenses Interest expense Income taxes 2018 2017 2016 41,800 $ 40,900 $ 39,800 $ 20.900 18,190 16.370 13,500 15,000 15.500 175 300 365 315 935 1.000 #S cu Print Done Meant wat Data Table se 2015 2018 3.100 $ 600 $ 2016 4.400 2017 3.400 $ 800 600 7,300 6,800 3,600 2.500 4.600 4.900 S 2.800 12,700 6,600 17,600 15,600 gel Selected balance sheet data Cash Marketable securities. Accounts receivable, net Inventory Total current assets Long-term assets Total assets Accounts payable Short-term notes payable Total current liabilities Total long-term liabilities 7,100 24,700 all 1,800 3,100 6,800 8.900 24,500 2,100 6,300 9,700 3,290 9,400 22,100 1.000 5,350 8,000 7,649 11,900 510 Print Done alents, SE- stockholders equity and ST = short-term. Round the ratios to two decimal places, XXX) (Click the icon to view selected income statement data.) Selected data from Treble Furniture, Inc., follows. (Click the icon to view selected balance sheet data.) Industry averages have been gathered for several ratios. (Click the icon to view the ratios.) Read the requirements Requirement 1. Perform a trend analysis on Trebie's sale while, Inventory, and receivables over the past three years, us Begin by calculating the trend analysis. (Round the ratios to nearest whole percent. X%.) 2018 2017 2016 2015 Net sales revenue 1101% 108 % 105 % 100% 100% 100% Inventory % % % Accounts receivable, net % % % Is the trend in each of these areas favorable or unfavorable for the company? The trend percentages for sales revenue is The trend percentago which is trend. in Inventory indicates a Requirement 2. Using the industry averages as benchmarks, analyze Treble's performance over the past three years in the fol a. Start by analyzing the liquidity ratios: the current ratio and the quick ratio. Select the formula and enter the amounts to calculate the current ratios for the years 2016 through 2018. (Round the ratios to tw Current assets Current liabilities Current ratio Choose from any list or enter any number in the input fields and then continue to the next question. ntory, and receivables over the past three years, using 2015 as the base. Is the trend in each of these areas favorable or unfavorable for the company? whole percent, X%.) 16 05% 2015 100% 100% % % 100 my? entage in inventory indicates a The trend percentage In not receivables is than the increase in sales. le's performance over the past three years in the following areas: a) liquidity. b) tumover, e) overall debt payment ability, and d) profitability he years 2016 through 2018. (Round the ratios to two decimal places, XXX) Current ratio ontinue to the next