Please help me with the following 28 questions! Only answer if you know the answers for sure. 1). A computer was purchased new in 2015.
Please help me with the following 28 questions! Only answer if you know the answers for sure.
1).
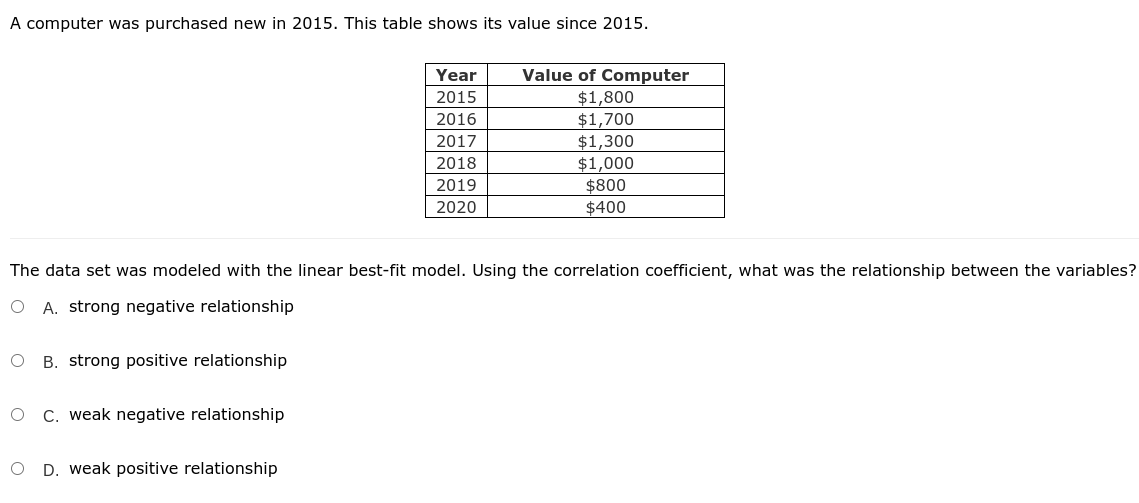
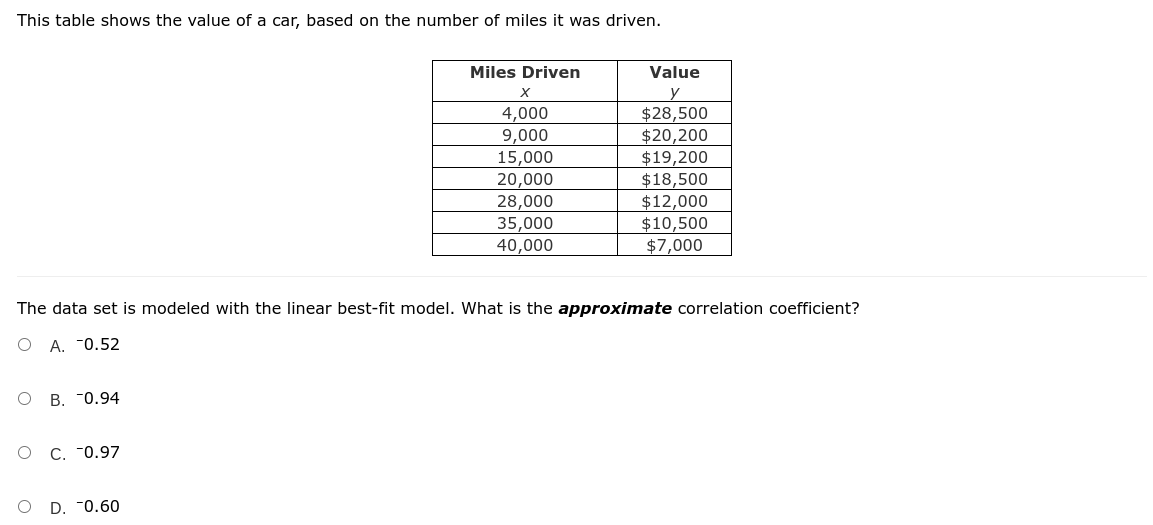
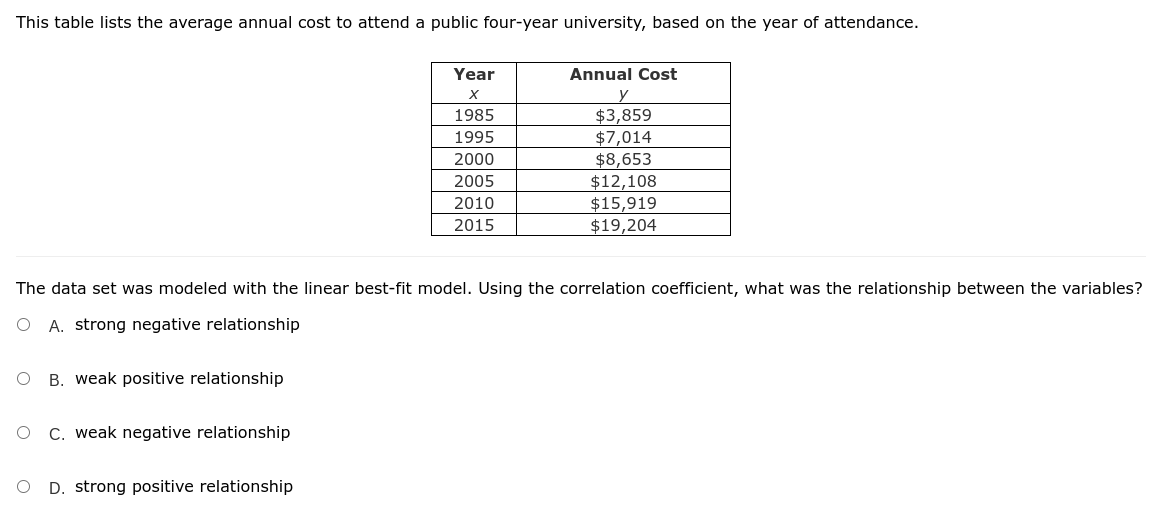
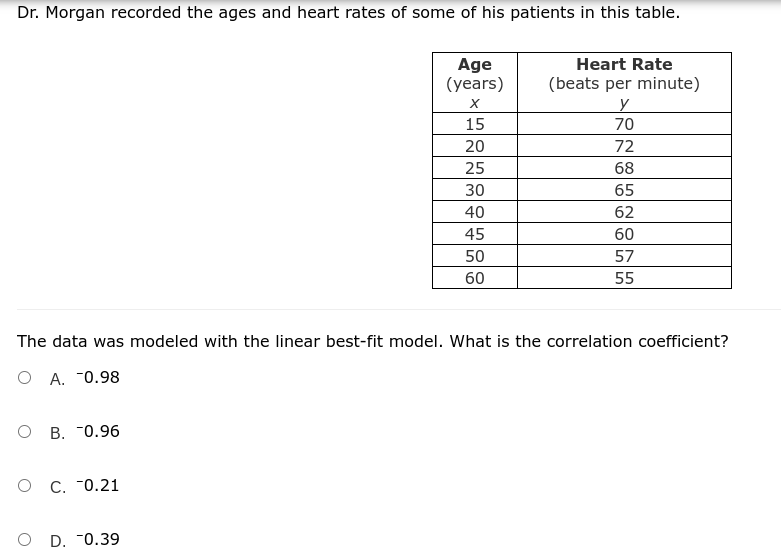
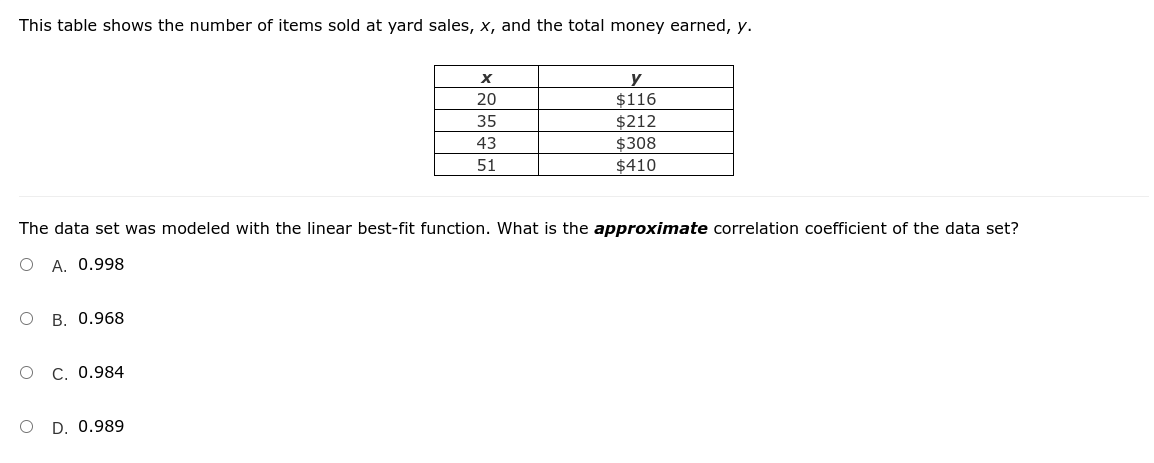
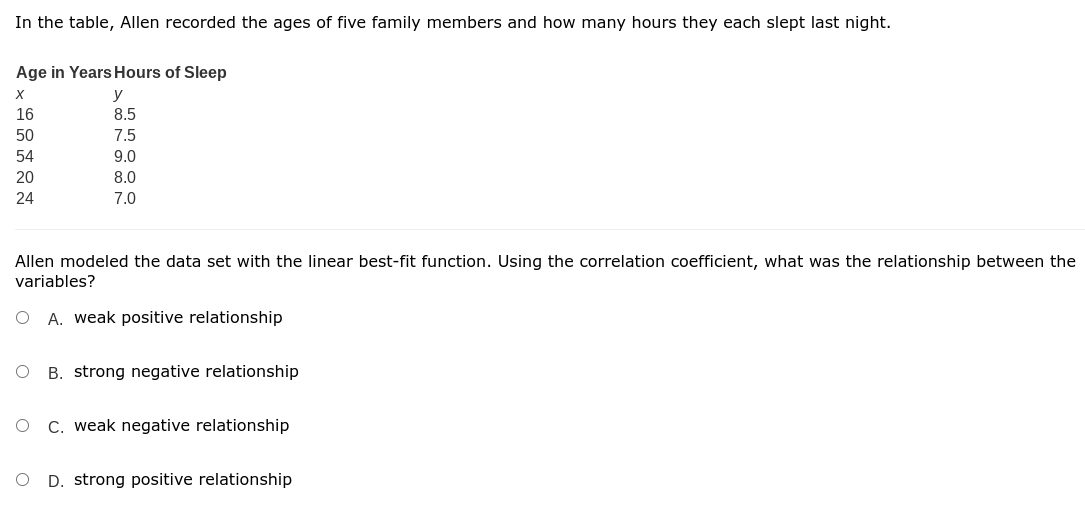
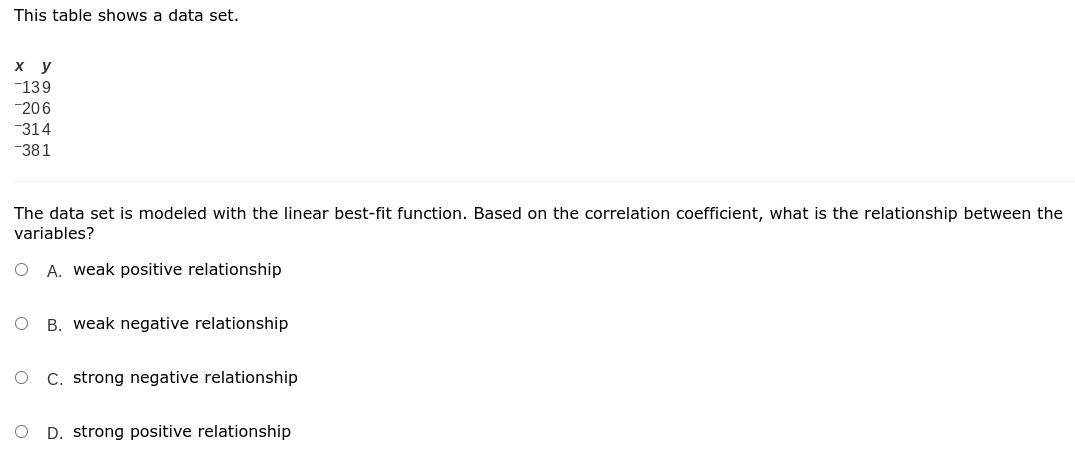
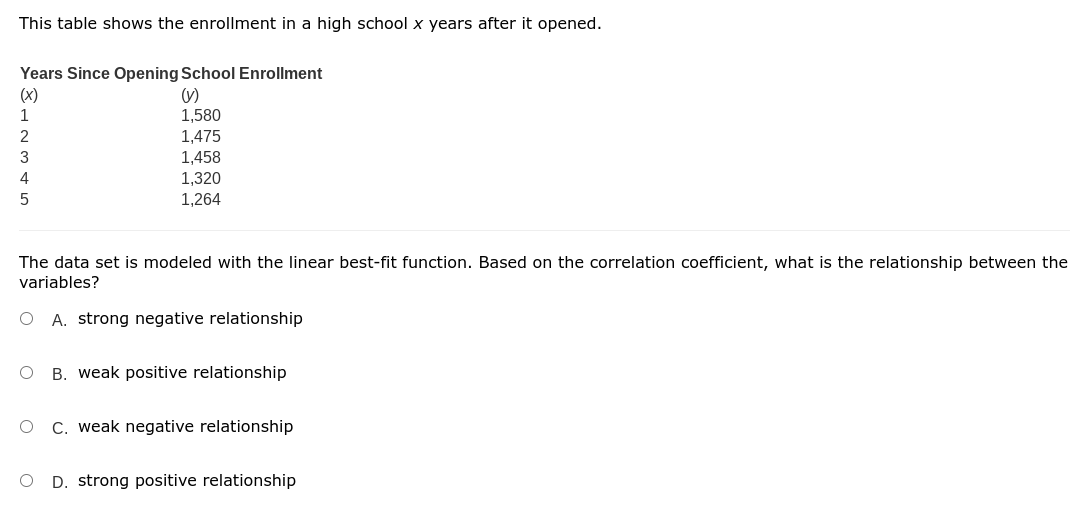
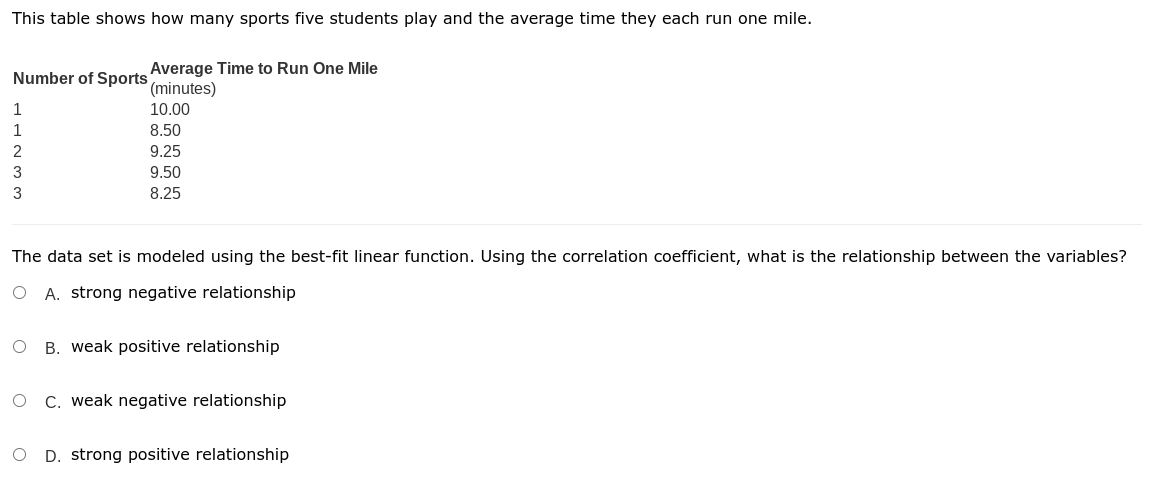
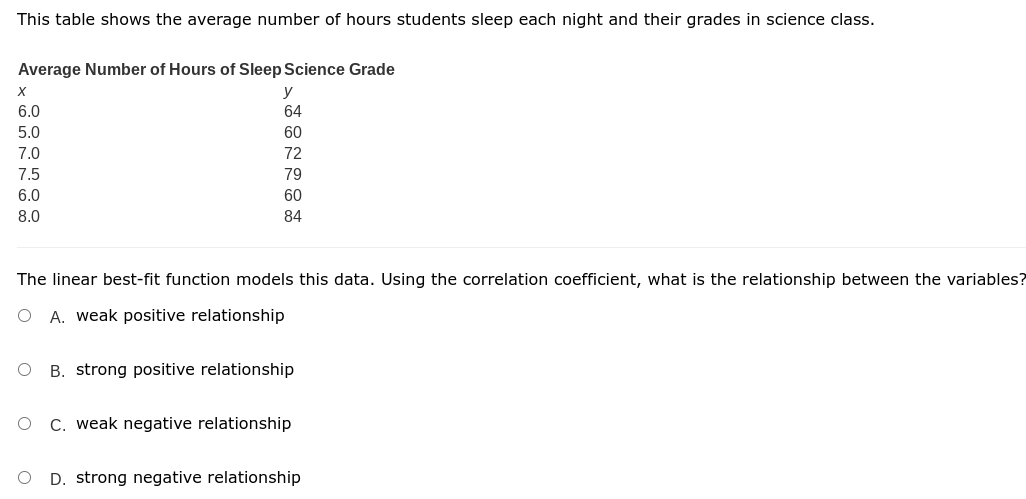
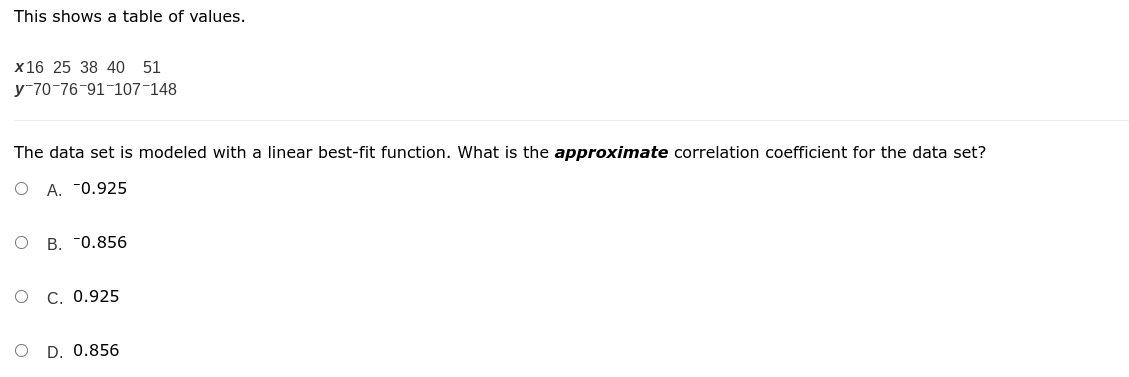
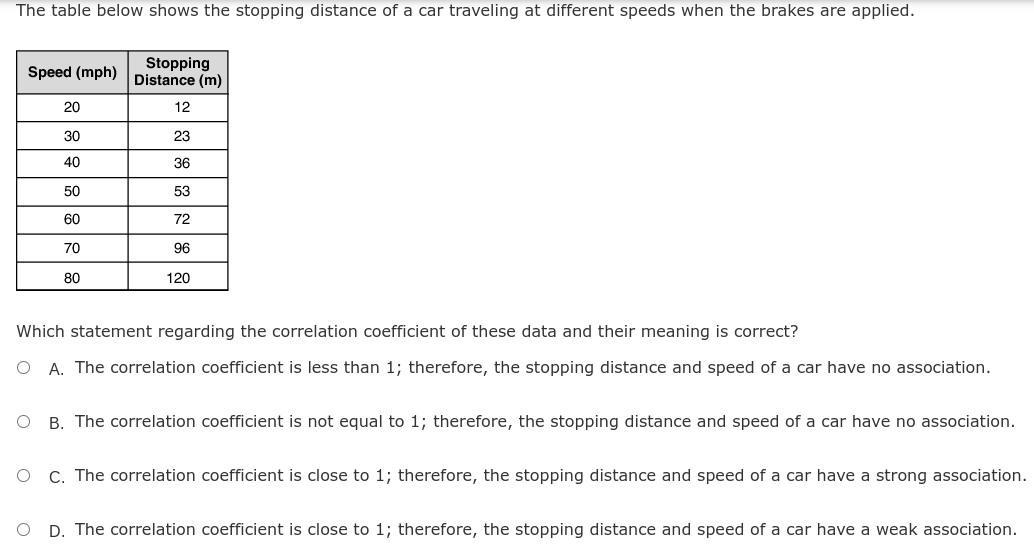
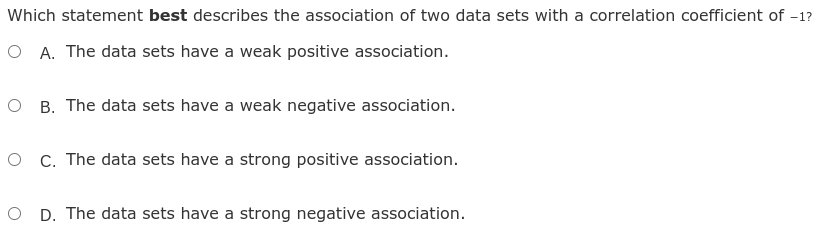
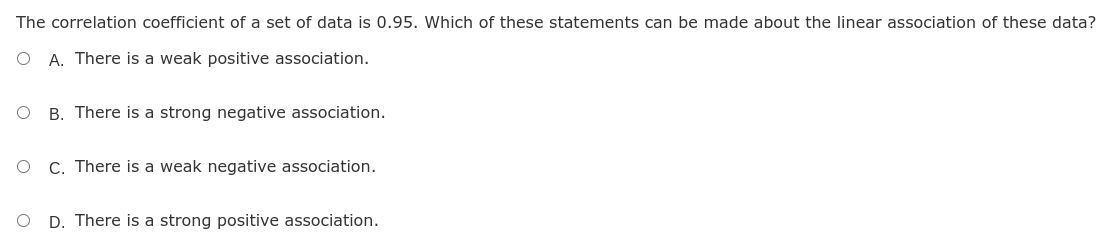
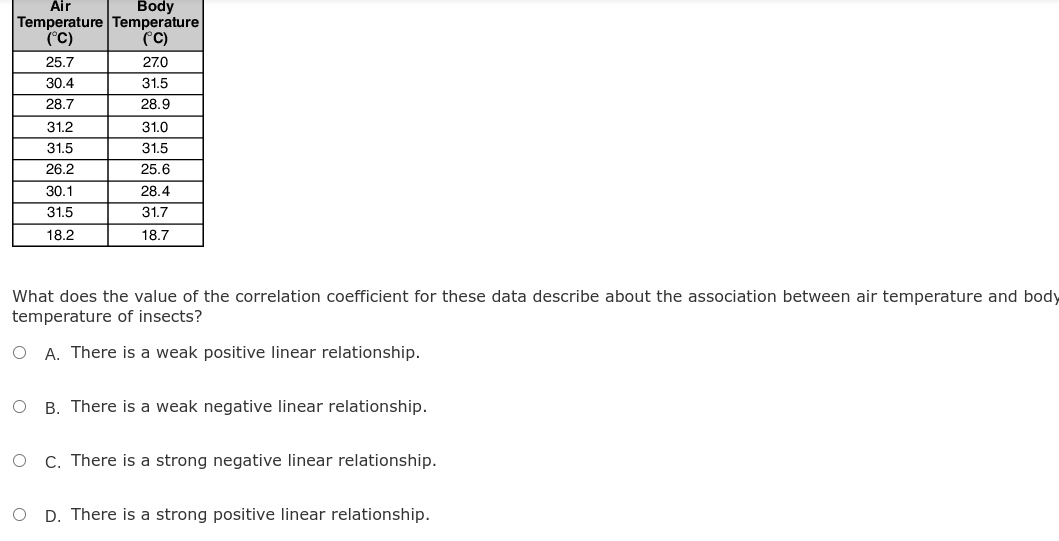
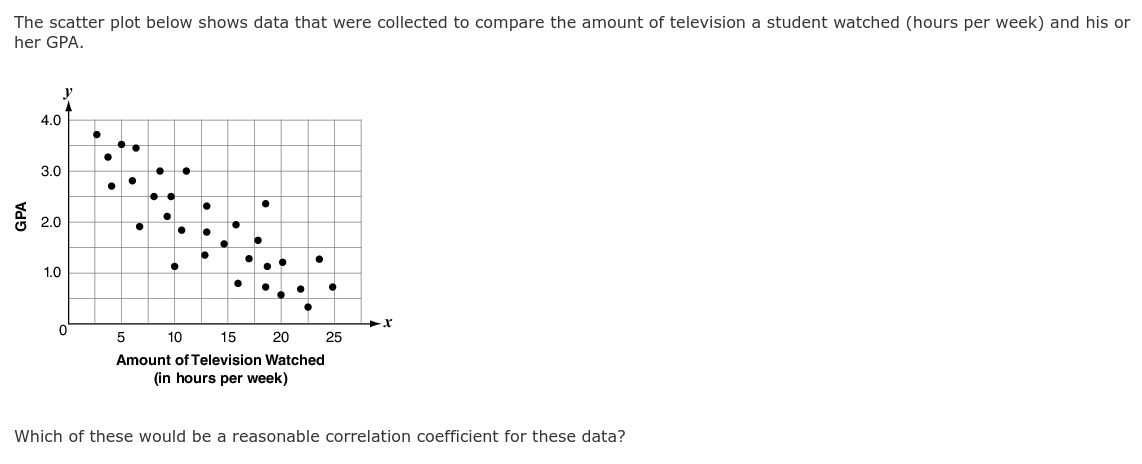
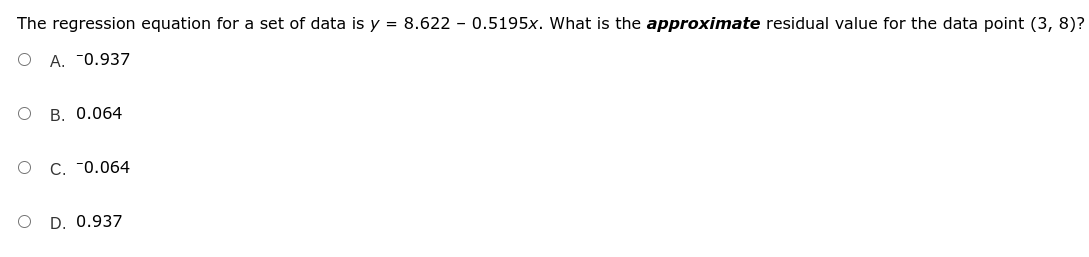
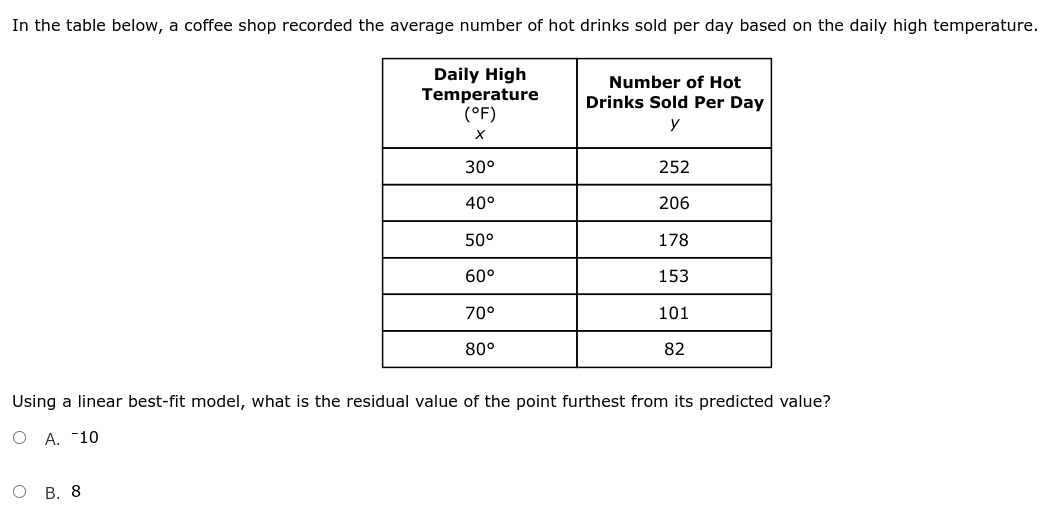
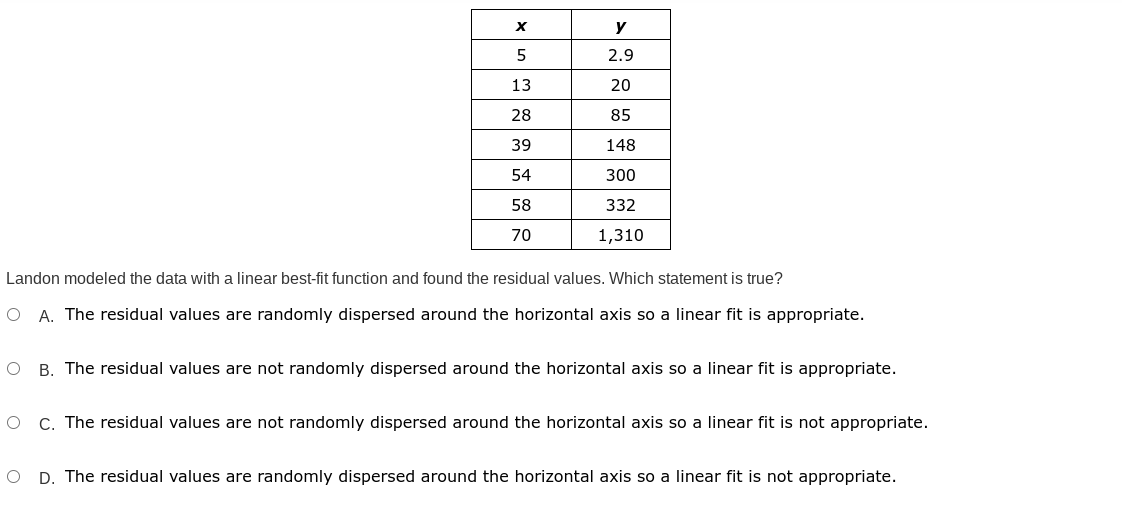
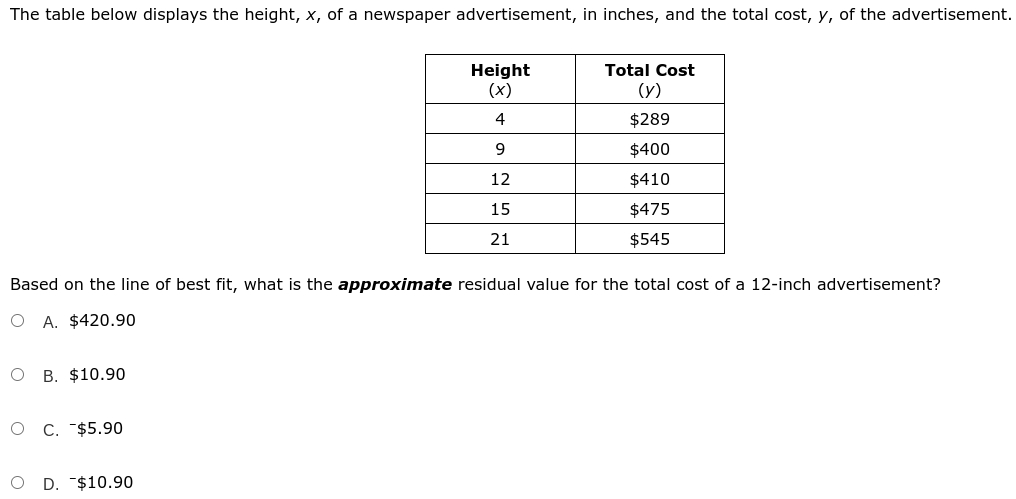
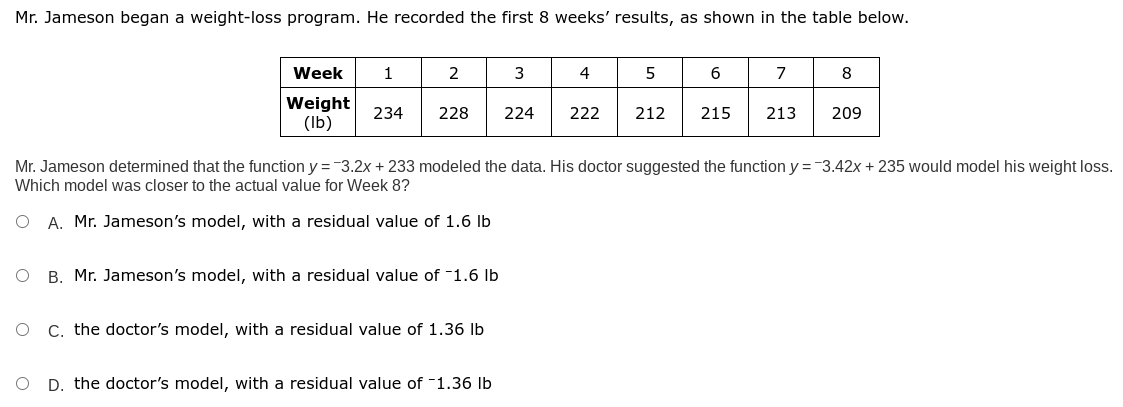
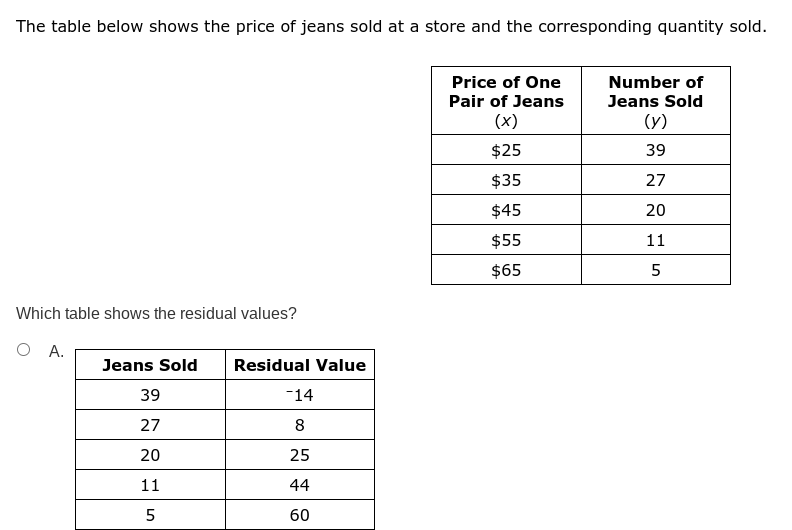
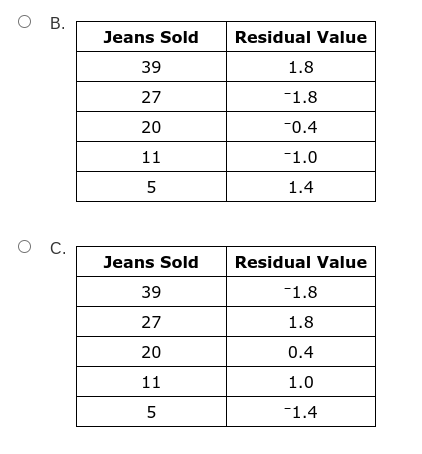
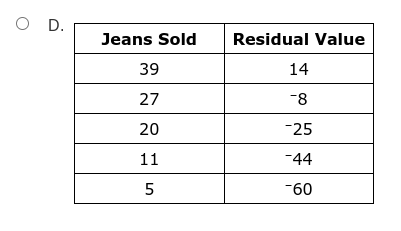
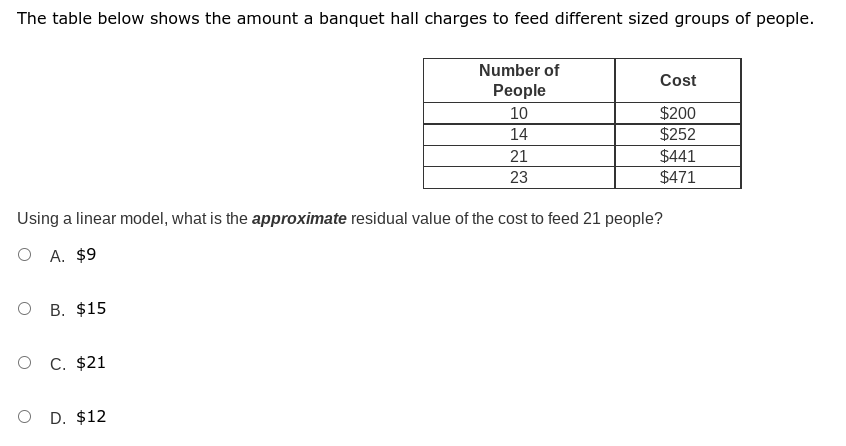
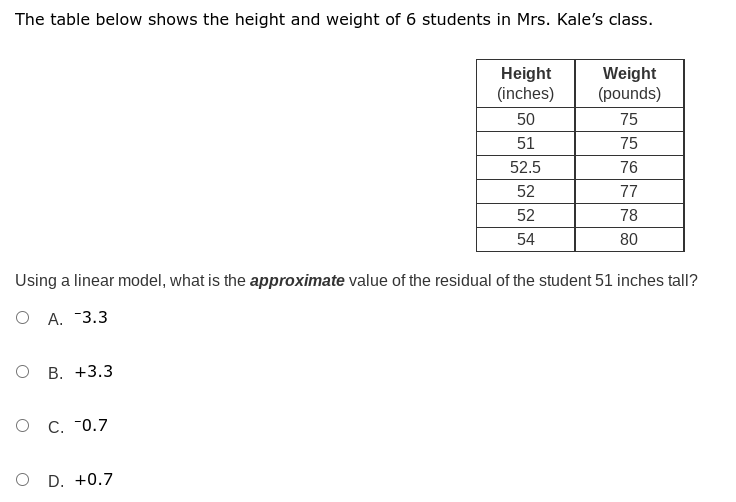
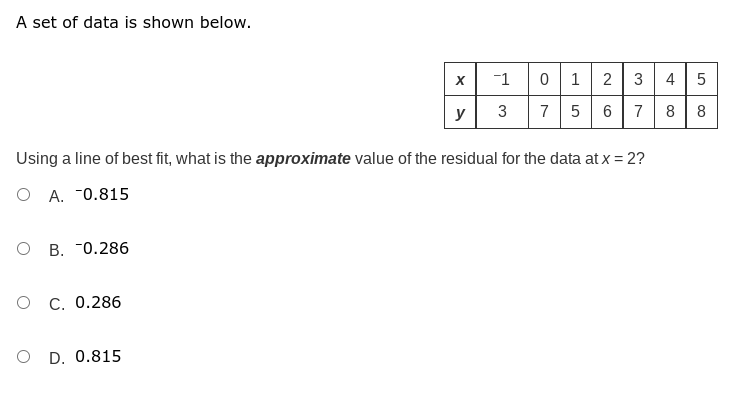
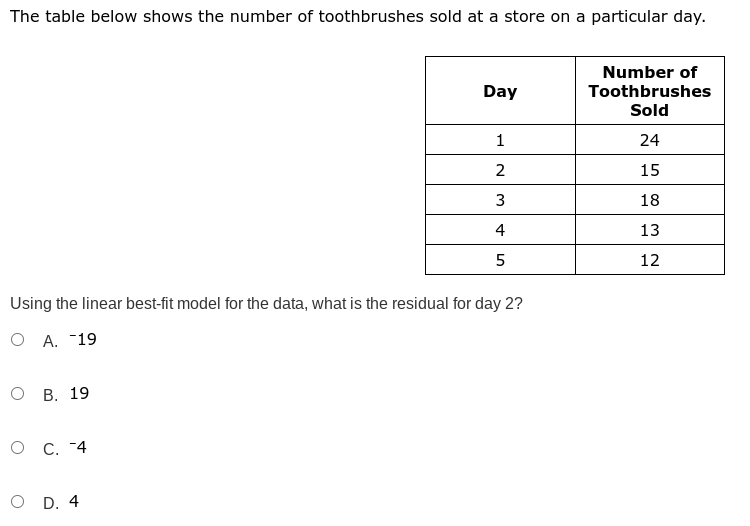
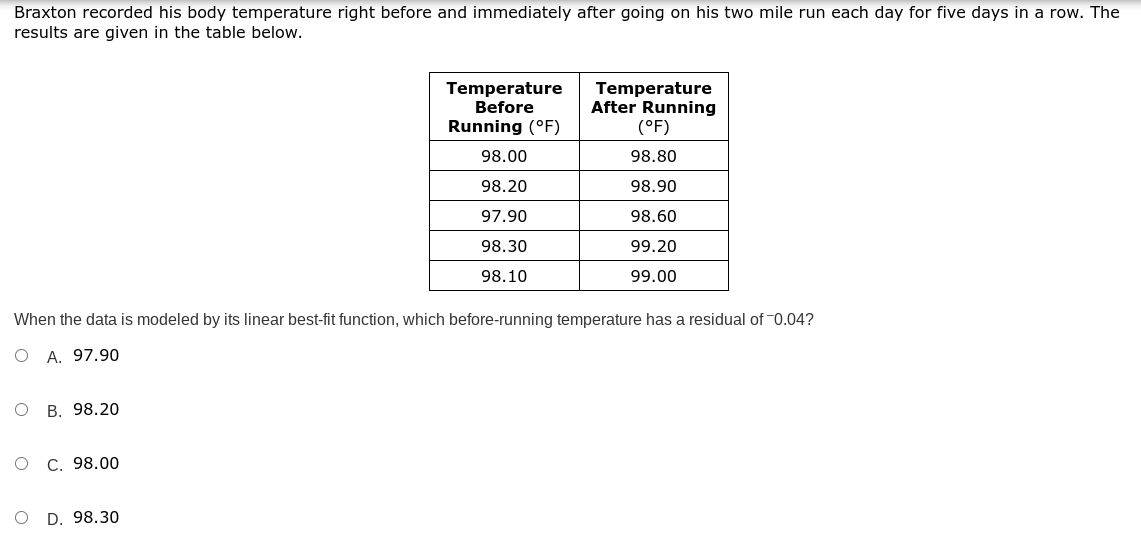
A computer was purchased new in 2015. This table shows its value since 2015. Year Value of Computer 2015 $1,800 2016 $1,700 2017 $1,300 2018 $1,000 2019 $800 2020 $400 The data set was modeled with the linear best-fit model. Using the correlation coefficient, what was the relationship between the variables? O A. strong negative relationship O B. strong positive relationship O c. weak negative relationship O D. weak positive relationshipThis table shows the value of a car, based on the number of miles it was driven. Miles Driven Value X y 4,000 $28,500 9,000 $20,200 15,000 $19,200 20,000 $18,500 28,000 $12,000 35,000 $10,500 40,000 $7,000 The data set is modeled with the linear best-fit model. What is the approximate correlation coefficient? O A. -0.52 O B. -0.94 O C. -0.97 O D. -0.60This table lists the average annual cost to attend a public four-year university, based on the year of attendance. Year Annual Cost X y 1985 $3,859 1995 $7,014 2000 $8,653 2005 $12, 108 2010 $15,919 2015 $19,204 The data set was modeled with the linear best-fit model. Using the correlation coefficient, what was the relationship between the variables? O A. strong negative relationship O B. weak positive relationship O c. weak negative relationship O D. strong positive relationshipDr. Morgan recorded the ages and heart rates of some of his patients in this table. Age Heart Rate (years) (beats per minute) X y 15 70 20 72 25 68 30 65 40 62 45 60 50 57 60 55 The data was modeled with the linear best-fit model. What is the correlation coefficient? O A. -0.98 O B. -0.96 O C. -0.21 O D. -0.39This table shows the number of items sold at yard sales, x, and the total money earned, y. x y 20 $116 35 $212 43 $303 51 $410 The data set was modeled with the linear best-t function. What is the approximate correlation coefficient of the data set? 0 A. 0.998 O B. 0.968 O C. 0.984 O D. 0.989 In the table, Allen recorded the ages of five family members and how many hours they each slept last night. Age in Years Hours of Sleep X y 16 8.5 50 7.5 54 9.0 20 8.0 24 7.0 Allen modeled the data set with the linear best-fit function. Using the correlation coefficient, what was the relationship between the variables? O A. weak positive relationship O B. strong negative relationship O c. weak negative relationship O D. strong positive relationshipThis table shows a data set. x y 139 -206 -314 -381 The data set is modeled with the linear best-fit function. Based on the correlation coefficient, what is the relationship between the variables? O A. weak positive relationship O B. weak negative relationship O c. strong negative relationship O D. strong positive relationshipThis table shows the enrollment in a high school x years after it opened. Years Since Opening School Enrollment (V) 1,580 1,475 1,458 1,320 1,264 The data set is modeled with the linear best-fit function. Based on the correlation coefficient, what is the relationship between the variables? O A. strong negative relationship O B. weak positive relationship O c. weak negative relationship O D. strong positive relationshipThis table shows how many sports five students play and the average time they each run one mile. Number of Sports Average Time to Run One Mile (minutes) 10.00 8.50 9.25 9.50 8.25 The data set is modeled using the best-fit linear function. Using the correlation coefficient, what is the relationship between the variables? O A. strong negative relationship O B. weak positive relationship O c. weak negative relationship O D. strong positive relationshipThis table shows the average number of hours students sleep each night and their grades in science class. Average Number of Hours of Sleep Science Grade X y 6.0 64 5.0 60 7.0 72 7.5 79 6.0 60 8.0 84 The linear best-fit function models this data. Using the correlation coefficient, what is the relationship between the variables? O A. weak positive relationship O B. strong positive relationship O c. weak negative relationship O D. strong negative relationshipThis shows a table of values. x16 25 38 40 51 y-70-76-91-107-148 The data set is modeled with a linear best-fit function. What is the approximate correlation coefficient for the data set? O A. -0.925 O B. -0.856 O C. 0.925 O D. 0.856The table below shows the stopping distance of a car traveling at different speeds when the brakes are applied. Speed (mph) Stopping Distance (m) 20 12 30 23 40 36 50 53 60 72 70 96 80 120 Which statement regarding the correlation coefficient of these data and their meaning is correct? O A. The correlation coefficient is less than 1; therefore, the stopping distance and speed of a car have no association. O B. The correlation coefficient is not equal to 1; therefore, the stopping distance and speed of a car have no association. O C. The correlation coefficient is close to 1; therefore, the stopping distance and speed of a car have a strong association. O D. The correlation coefficient is close to 1; therefore, the stopping distance and speed of a car have a weak association.Which statement best describes the association of two data sets with a correlation coefficient of 1? O A. The data sets have a weak positive association. 0 B. The data sets have a weak negative association. O c_ The data sets have a strong positive association. 0 [1 The data sets have a strong negative association. The correlation coefficient of a set of data is 0.95. Which of these statements can be made about the linear association of these data? O A. There is a weak positive association. O B. There is a strong negative association. O C. There is a weak negative association. O D. There is a strong positive association.What does the value of the correlation coefficient for these data describe about the association between air tempelature and body temperature of insects? O A_ There is a weak positive linear relationship. 0 B. There is a weak negative linear relationship. 0 c_ There is a strong negative linear relationship. 0 [1 There is a strong positive linear relationship. \f\fThe scatter plot below shows data that were collected to compare the amount of television a student watched (hours per week] and his or her GPA. D510152025 Amount oiTelavlalon Watched (In hours per week) Which of these would be a reasonable correlation coefficient for these data? The regression equation for a set of data is y = 8.622 0.5195x. What is the approximate residual value for the data point (3, 8)? O A. 13.937 0 B. 0.064 O C. "0.064 O D. 0.937 In the table below, a coffee shop recorded the average number of hot drinks sold per day based on the daily high temperature. Daily High Temperature Number of Hot ( OF) Drinks Sold Per Day X y 30 252 40 206 50 178 60 153 70 101 80 82 Using a linear best-fit model, what is the residual value of the point furthest from its predicted value? O A. -10 O B. 8x y s 2.9 13 20 28 85 39 148 54 300 58 332 70 1,310 Landon modeled the data with a linear bestt function and found the residual values. Which statement is true? 0 A_ The residual values are randomly dispersed around the horizontal axis so a linear t is appropriate. O B. The residual values are not randomly dispersed around the horizontal axis so a linear fit is appropriate. O c; The residual values are not randomly dispersed around the horizontal axis so a linear fit is not appropriate. 0 [)_ The residual values are randomly dispersed around the horizontal axis so a linear t is not appropriate. The table below displays the height, X, of a newspaper advertisement, in inches, and the total cost, y, of the advertisement. Height Total Cost (X) (Y) 4 $289 9 $400 12 $410 15 $475 21 $545 Based on the line of best fit, what is the approximate residual value for the total cost of a 12-inch advertisement? 0 A. $420.90 C) B. $10.90 0 C. 35.90 0 D. $10.90 Mr. Jameson began a weight-loss program. He recorded the first 8 weeks\" results, as shown in the table below. Week 1 2 3 4 5 5 7 8 \"g\" 234 228 224 222 212 215 213 209 Mr. Jameson determined that the function y = '3.2x + 233 modeled the data. His doctor suggested the function y = '3.42x + 235 would model his weight loss. Which model was closer to the actual value for Week 3? O A_ Mr. Jameson's model, with a residual value of 1.6 lb 0 B. Mr. Jameson's model, with a residual value of '1.6 lb 0 c_ the doctor's model, with a residual value of 1.36 lb 0 [)_ the doctor's model, with a residual value of '1.36 lb The table below shows the price of jeans sold at a store and the corresponding quantity:r sold. Price of [line Number of Fair of Jeans Jeans Sold (1!) 39 2? 2D 11 WhiCh table shows the residual values? O A. Residual 1lll'alue a 2D 25 44 an \f\fThe table below shows the amount a banquet hall charges to feed different sized groups of people. Number of People Cost 10 $200 14 $252 21 $441 23 $471 Using a linear model, what is the approximate residual value of the cost to feed 21 people? O A. $9 O B. $15 O C. $21 O D. $12The table below shows the height and weight of 6 students in Mrs. Kale's class. Height Weight (inches) (pounds) 50 75 51 75 52.5 76 52 77 52 78 54 80 Using a linear model, what is the approximate value of the residual of the student 51 inches tall? O A. -3.3 O B. +3.3 O C. -0.7 O D. +0.7A set of data is shown below. X -1 0 1 2 3 4 5 y 3 7 5 6 7 8 8 Using a line of best fit, what is the approximate value of the residual for the data at x = 2? O A. -0.815 O B. -0.286 O C. 0.286 O D. 0.815The table below shows the number of toothbrushes sold at a store on a particular day. Number of Day Toothbrushes Sold 24 2 15 W 18 4 13 5 12 Using the linear best-fit model for the data, what is the residual for day 2? O A. -19 O B. 19 O C. -4 O D. 4Braxton recorded his body temperature right before and immediately after going on his two mile run each day for five days in a row. The results are given in the table below. Temperature Temperature Before Aer Running Running (FJ (\"F} 98.00 98.80 98.20 98.90 97.90 98.60 98.30 99.20 98.10 99.00 When the data is modeled by its linear besttfunction, which beforerunning temperature has a residual of '004? O A. 97.90 O B. 98.20 0 C. 98.00 0 D. 98.30
Step by Step Solution
There are 3 Steps involved in it
Step: 1
Get Instant Access to Expert-Tailored Solutions
See step-by-step solutions with expert insights and AI powered tools for academic success
Step: 2
Step: 3
Ace Your Homework with AI
Get the answers you need in no time with our AI-driven, step-by-step assistance