

Question
please help me with the following python code, Thank you very much Python Script import matplotlib.pyplot as plt import numpy as np population=763 Scur=population-1 Icur=1
please help me with the following python code, Thank you very much
Python Script
import matplotlib.pyplot as plt import numpy as np population=763 Scur=population-1 Icur=1 Rcur=0 ##Get value for r and a from user trans_const=float(input("Enter value for r: ")) recov_rate=float(input("Enter value for a: ")) simlength=20 SIRarray=np.zeros((simlength+1,3)) SIRarray[0,:]=Scur,Icur,Rcur for i in range(1,simlength+1): new_infected=trans_const *Scur *Icur new_recovered=recov_rate * Icur Scur=Scur -new_infected cur=Icur+new_infected -new_recovered Rcur=Rcur + new_recovered SIRarray[i,:]=Scur,Icur,Rcur for i in range(len(SIRarray)): print("{0:.2f}\t\t{1:.2f}\t\t{2:.2f}".format(SIRarray[i,0],SIRarray[i,1],SIRarray[i,2])) plt.plot(SIRarray[:,0],"b") plt.plot(SIRarray[:,1],"r") plt.plot(SIRarray[:,2],"g") ##Set x axis and y axis label for the plot plt.xlabel("SIR") plt.ylabel("Count") ##Set title for the plot along with r and a value plt.title("SIR Plot With r= "+str(trans_const)+" AND a= "+str(recov_rate)) ##Save the plot along with r and a value named file plt.savefig("SIRplot_with_r_"+str(trans_const)+"_and_a_"+str(recov_rate)+".png") plt.show() 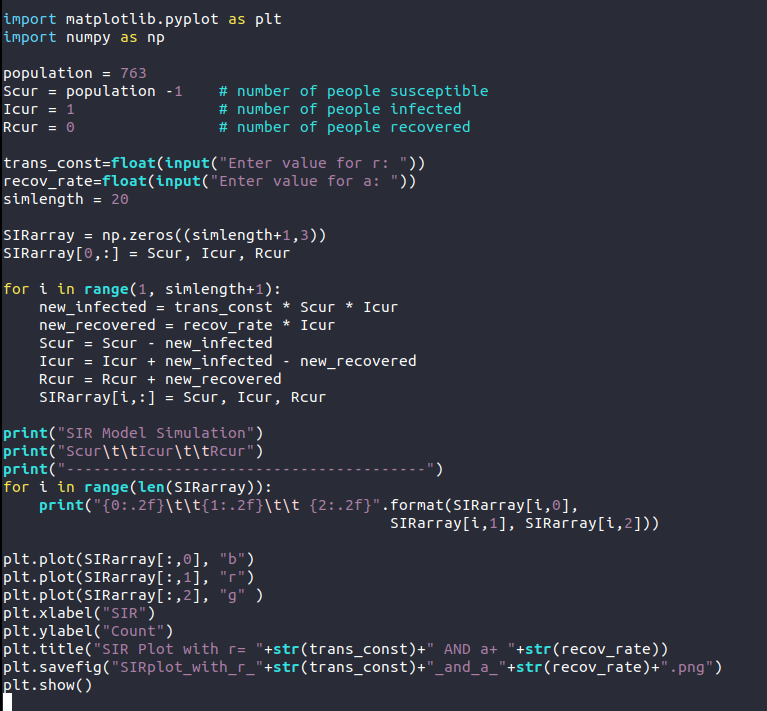
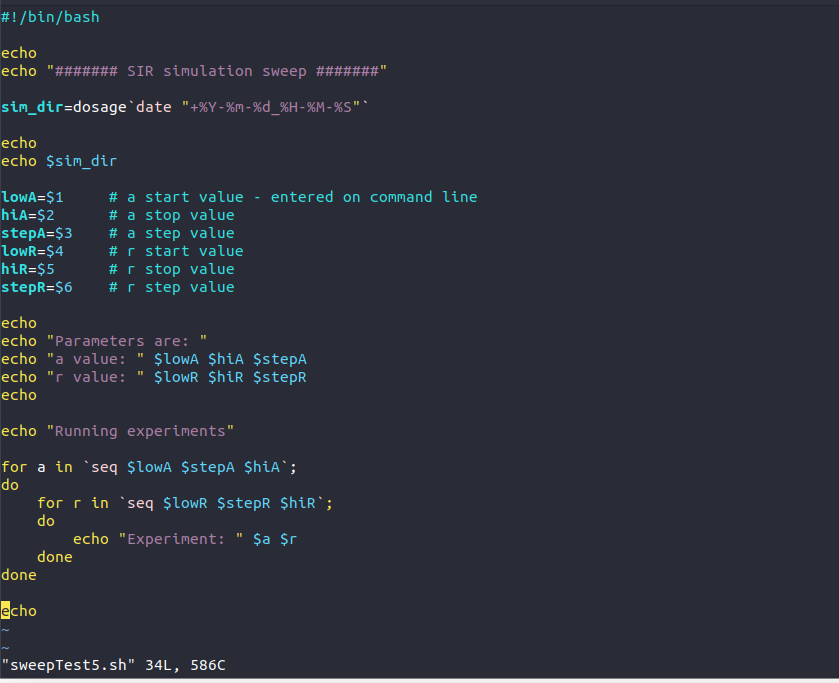
Bash Script
XI/bin/hash
echo
echo ####### SIR simulation sweep #######
sim_dir=dosage`date +%Y-%m-%d_%H-%M-%S`
echo
echo $sim_dir
lowA=$1 # a start value entered on commond line
hiA=$2 # a stop value
stepA=$3. # a step value
lowR=$4. # r start value
hiR=$5. # r step value
echo
echo Prameters are:
echo a value: $lowA shiA $stepA
echo r value: $lowR $shiR $stepR
echo
echo Running experiments
for a in `seq $lowA $stepA $shiAs`;
do
for r in `seq $lowA $stepA $ShiR`;
do
echo Experiment: $a $r
done
done
echo
******
r value is 0.00218
a value is 0.5
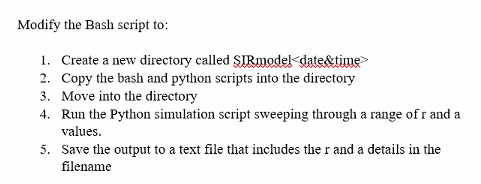
Task For This Pragram
Thank You Very Much
import matplotlib.pyplot as plt import numpy as np population = 763 Scur = population - 1 # number of people susceptible Icur = 1 # number of people infected Rcur = 0 # number of people recovered trans_const=float(input("Enter value for r: ")) recov_rate=float(input("Enter value for a: ")) sinlength = 20 SIRrray = np.zeros((simlength+1,3)) SIRrray[0,:] = Scur, Icur, Rcur for i in range(1, simlength+1): new_infected = trans_const * Scur * Icur new_recovered = recov_rate * Icur Scur = Scur - new_infected Icur = Icur + new_infected - new_recovered Rcur = Rcur + new_recovered SIRrray[i,:] Scur, Icur, Rour print("SIR Model Simulation") print("Scur\t\ticur\t\trcur") print(". for i in range(len(SIRrray)): print("{0::2f}\t\t{1:.2f}\t\t {2:.2f}".format(SIRrray[i,0], SIRrray[i,1], SIRrray[i,2])) plt.plot(SIRrray[:,0], "b") plt.plot(SIRrray[:,1], "r") plt.plot(SIRrray[:,2], "g" ) plt.xlabel("SIR") plt.ylabel("Count") plt.title("SIR Plot with r= "+str(trans_const)+" AND a+ "+str(recov_rate)) plt.savefig("SIRplot_with_r_"+str(trans_const)+"_and_a_"+str(recov_rate)+".png") plt.show() #!/bin/bash echo echo ####### SIR simulation sweep ##### sim_dir=dosage date "+%Y-%m-%d_%H - %M-%5"- echo echo $sim_dir lowA=$1 hiA=$2 stepA=$3 LowR=$4 hiR=$5 stepR=$6 # a start value - entered on command line # a stop value # a step value # r start value # r stop value # r step value echo echo "Parameters are: echo "a value: " Slowa hia $stepa echo "value: " Slow ShiR $stepR echo echo "Running experiments" for a in `seq SlowA $stepa Shia ; do for r in `seq SlowR $step Shir; do echo "Experiment: " $a $r done done echo "sweepTest5.sh" 34L, 586C Modify the Bash script to: 1. Create a new directory called SIRmodelStep by Step Solution
There are 3 Steps involved in it
Step: 1

Get Instant Access to Expert-Tailored Solutions
See step-by-step solutions with expert insights and AI powered tools for academic success
Step: 2

Step: 3
Ace Your Homework with AI
Get the answers you need in no time with our AI-driven, step-by-step assistance
Get Started
Database Technology And Management Computers And Information Processing Systems For Business
Authors: Robert C. Goldstein
1st Edition
0471887374, 978-0471887379