Please help me with the matlab code and image
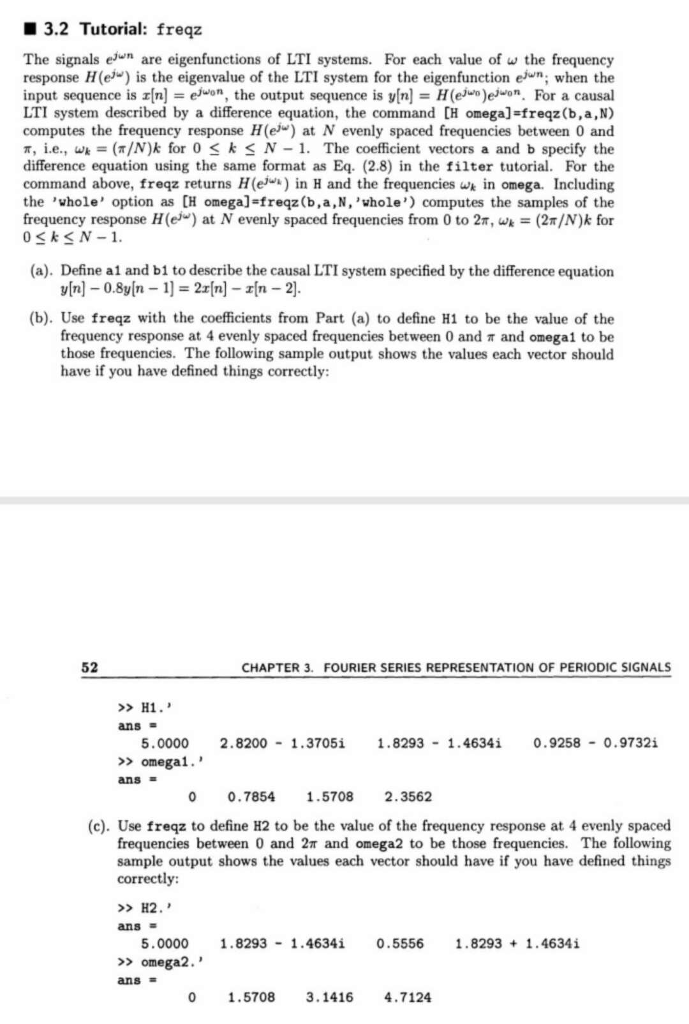
3.2 Tutorial: freaz The signals en are eigenfunctions of LTI systems. For each value of w the frequency response H (e) is the eigenvalue of the LTI system for the eigenfunction en when the input sequence is [n-ejwon, the output sequence is y[n] = H(ejwo)ejwon. For a causal LTI system described by a difference equation, the command CH omega]-freqz(b,a,N) computes the frequency response H(e at N evenly spaced frequencies between 0 and r, i.e., wk = (/N)k for 0 k N-1. The coefficient vectors a and b specify the difference equation using the same format as Eq. (2.8) in the filter tutorial. For the command above, freqz returns H(e in H and the frequencies wk in omega. Including the 'whole' option as [H omega freqz(b,a,N, 'whole) computes the samples of the frequency response H (e*) at N evenly spaced frequencies from 0 to 27, wk = (2/N)k for 0SkN -1 (a). Define al and b1 to describe the causal LTI system specified by the difference equation (b). Use freqz with the coefficients from Part (a) to define H1 to be the value of the frequency response at 4 evenly spaced frequencies between 0 and and omega 1 to be those frequencies. The following sample output shows the values each vector should have if you have defined things correctly 52 CHAPTER 3. FOURIER SERIES REPRESENTATION OF PERIODIC SIGNALS >H1. 5.0000 2.8200 1.37051 1.8293 1.46341 0.9258 0.9732i omegal.' 0 0.7854 1.5708 2.3562 (c). Use freqz to define H2 to be the value of the frequency response at 4 evenly spaced frequencies between 0 and 2 and omega2 to be those frequencies. The following sample output shows the values each vector should have if you have defined things correctly: >>H2. 5.0000 1.8293 1.46341 0.55561.82931.46341 omega2.' 0 1.5708 3.1416 4.7124 3.2 Tutorial: freaz The signals en are eigenfunctions of LTI systems. For each value of w the frequency response H (e) is the eigenvalue of the LTI system for the eigenfunction en when the input sequence is [n-ejwon, the output sequence is y[n] = H(ejwo)ejwon. For a causal LTI system described by a difference equation, the command CH omega]-freqz(b,a,N) computes the frequency response H(e at N evenly spaced frequencies between 0 and r, i.e., wk = (/N)k for 0 k N-1. The coefficient vectors a and b specify the difference equation using the same format as Eq. (2.8) in the filter tutorial. For the command above, freqz returns H(e in H and the frequencies wk in omega. Including the 'whole' option as [H omega freqz(b,a,N, 'whole) computes the samples of the frequency response H (e*) at N evenly spaced frequencies from 0 to 27, wk = (2/N)k for 0SkN -1 (a). Define al and b1 to describe the causal LTI system specified by the difference equation (b). Use freqz with the coefficients from Part (a) to define H1 to be the value of the frequency response at 4 evenly spaced frequencies between 0 and and omega 1 to be those frequencies. The following sample output shows the values each vector should have if you have defined things correctly 52 CHAPTER 3. FOURIER SERIES REPRESENTATION OF PERIODIC SIGNALS >H1. 5.0000 2.8200 1.37051 1.8293 1.46341 0.9258 0.9732i omegal.' 0 0.7854 1.5708 2.3562 (c). Use freqz to define H2 to be the value of the frequency response at 4 evenly spaced frequencies between 0 and 2 and omega2 to be those frequencies. The following sample output shows the values each vector should have if you have defined things correctly: >>H2. 5.0000 1.8293 1.46341 0.55561.82931.46341 omega2.' 0 1.5708 3.1416 4.7124