

Answered step by step
Verified Expert Solution
Question
1 Approved Answer
Please help me with the Python code question Exercise:- Draw a line graph that shows the population of China and Population of Vietnam. Population of
Please help me with the Python code question

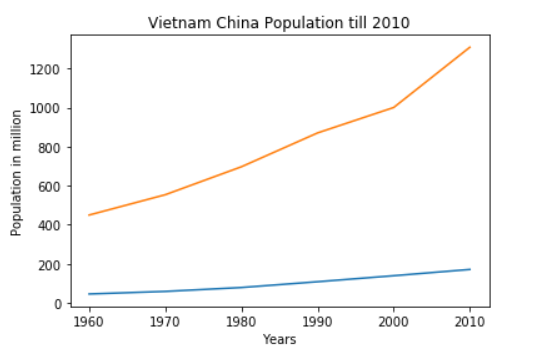
Exercise:- Draw a line graph that shows the population of China and Population of Vietnam. Population of China by year:- year = [1960, 1970, 1980, 1990, 2000, 2010) pop_china = [449.48, 553.57, 696.783, 870.133, 1000.4, 1309.1] Vietnam China Population till 2010 1200 1000 800 Population in million 600 400 200 0 1960 1970 2000 2010 1980 1990 Years
Step by Step Solution
There are 3 Steps involved in it
Step: 1

Get Instant Access to Expert-Tailored Solutions
See step-by-step solutions with expert insights and AI powered tools for academic success
Step: 2

Step: 3
Ace Your Homework with AI
Get the answers you need in no time with our AI-driven, step-by-step assistance
Get Started
DB2 11 The Database For Big Data And Analytics
Authors: Cristian Molaro, Surekha Parekh, Terry Purcell, Julian Stuhler
1st Edition