please help me with these questions much appreciated
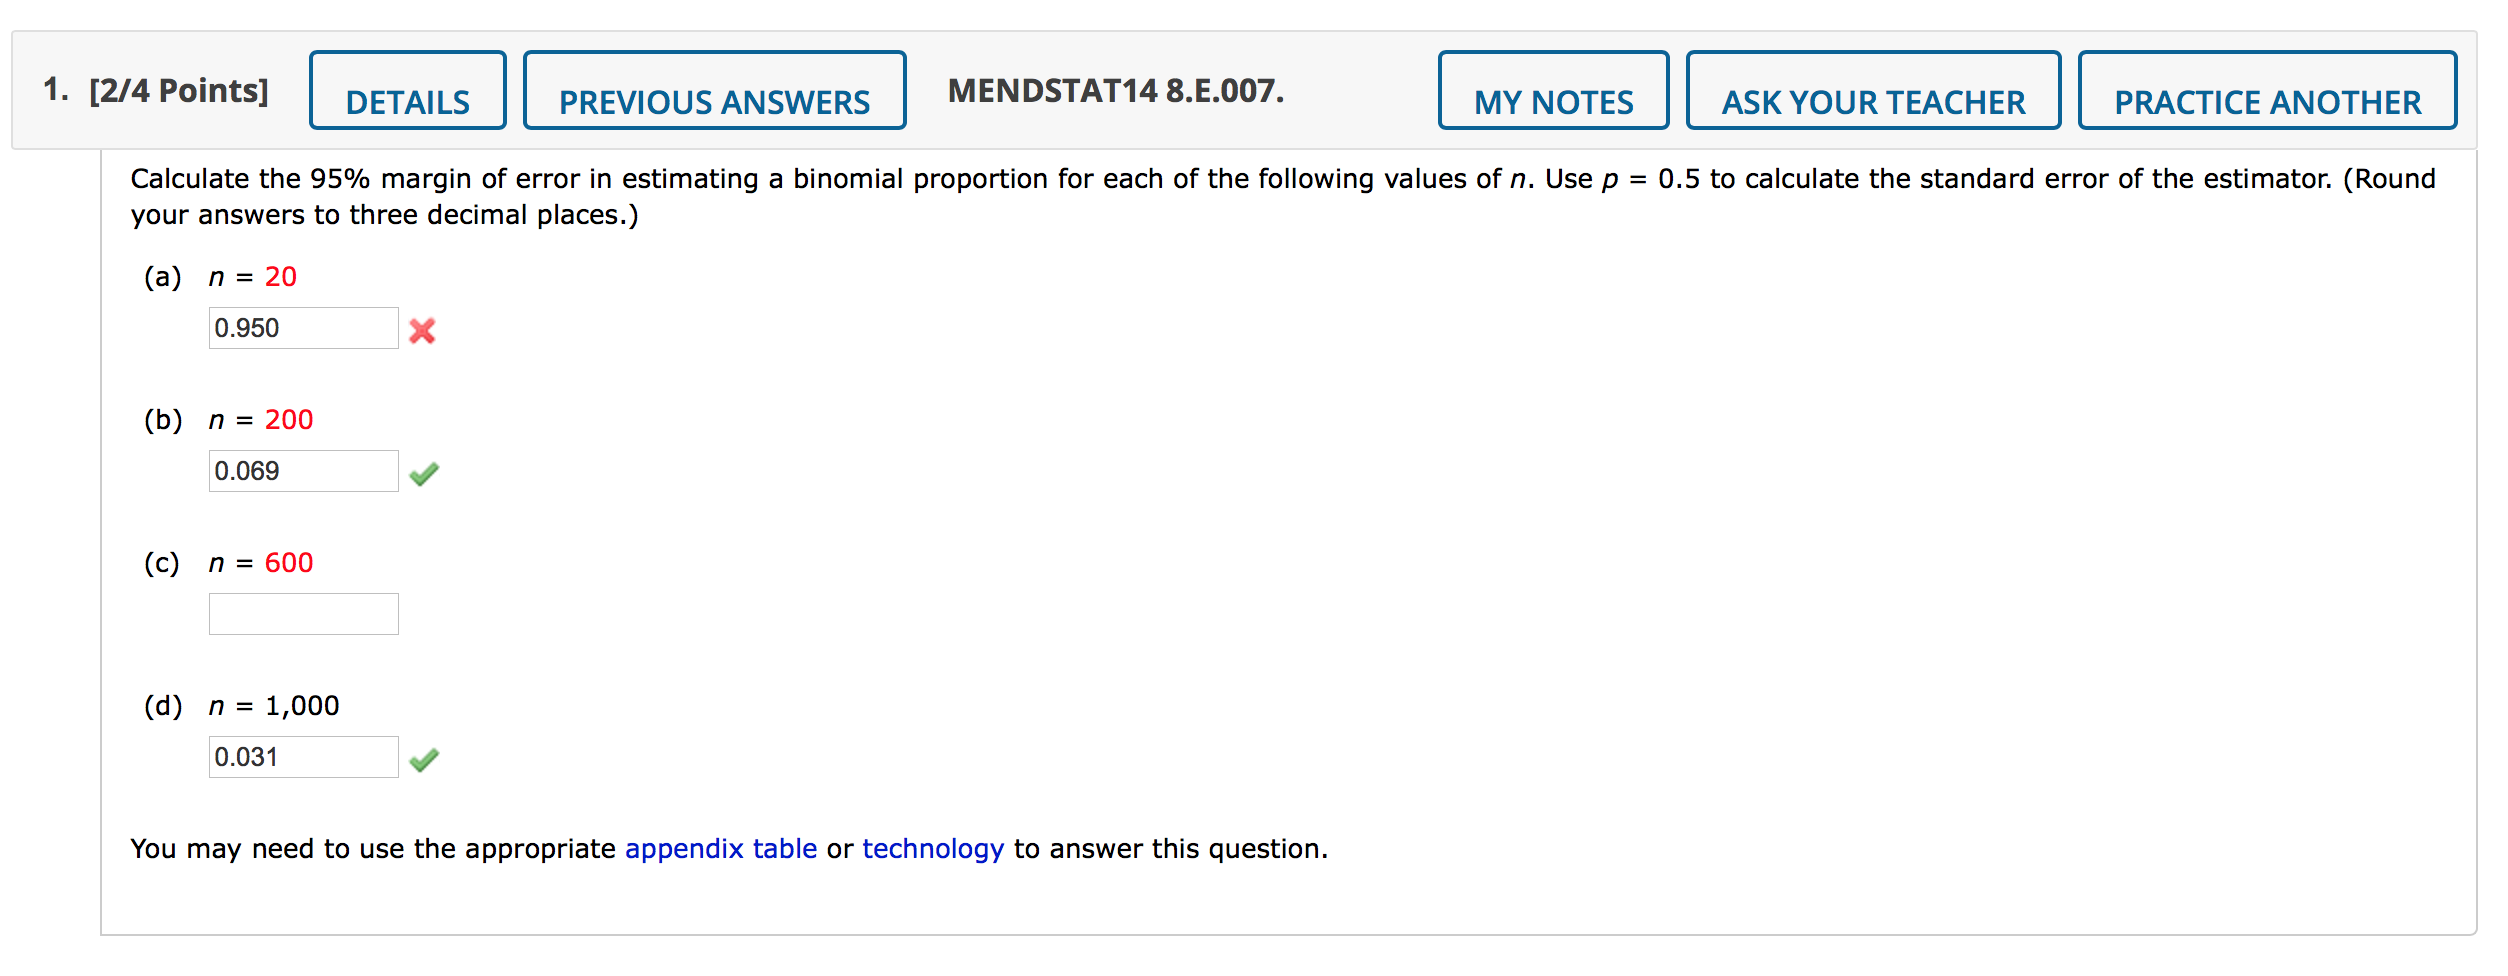
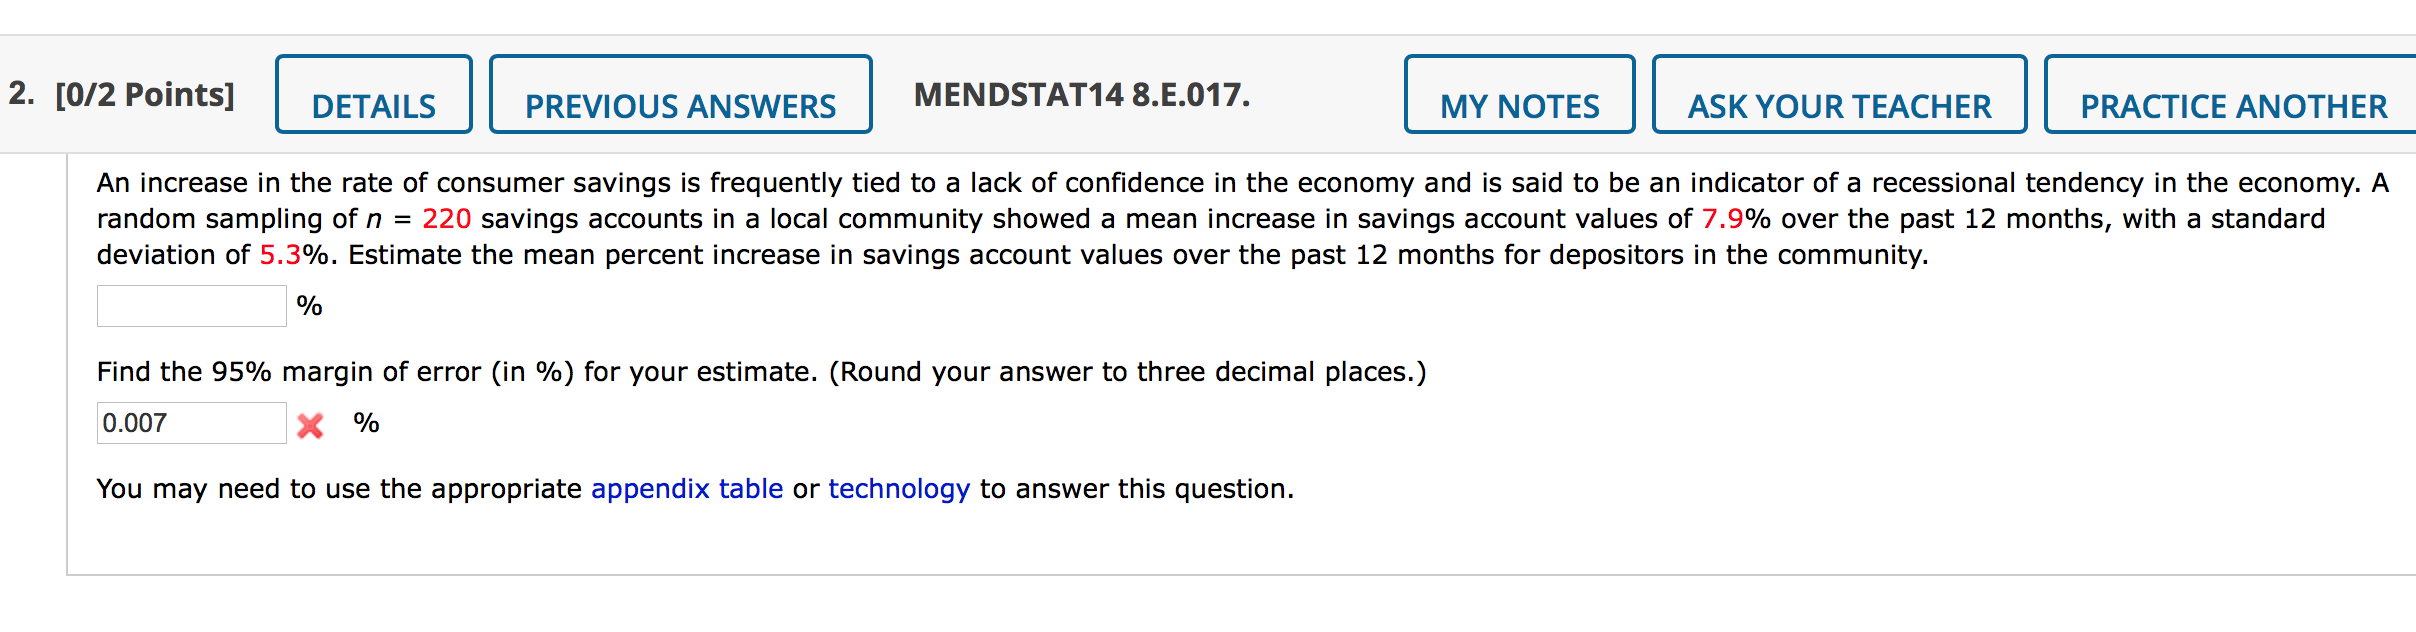
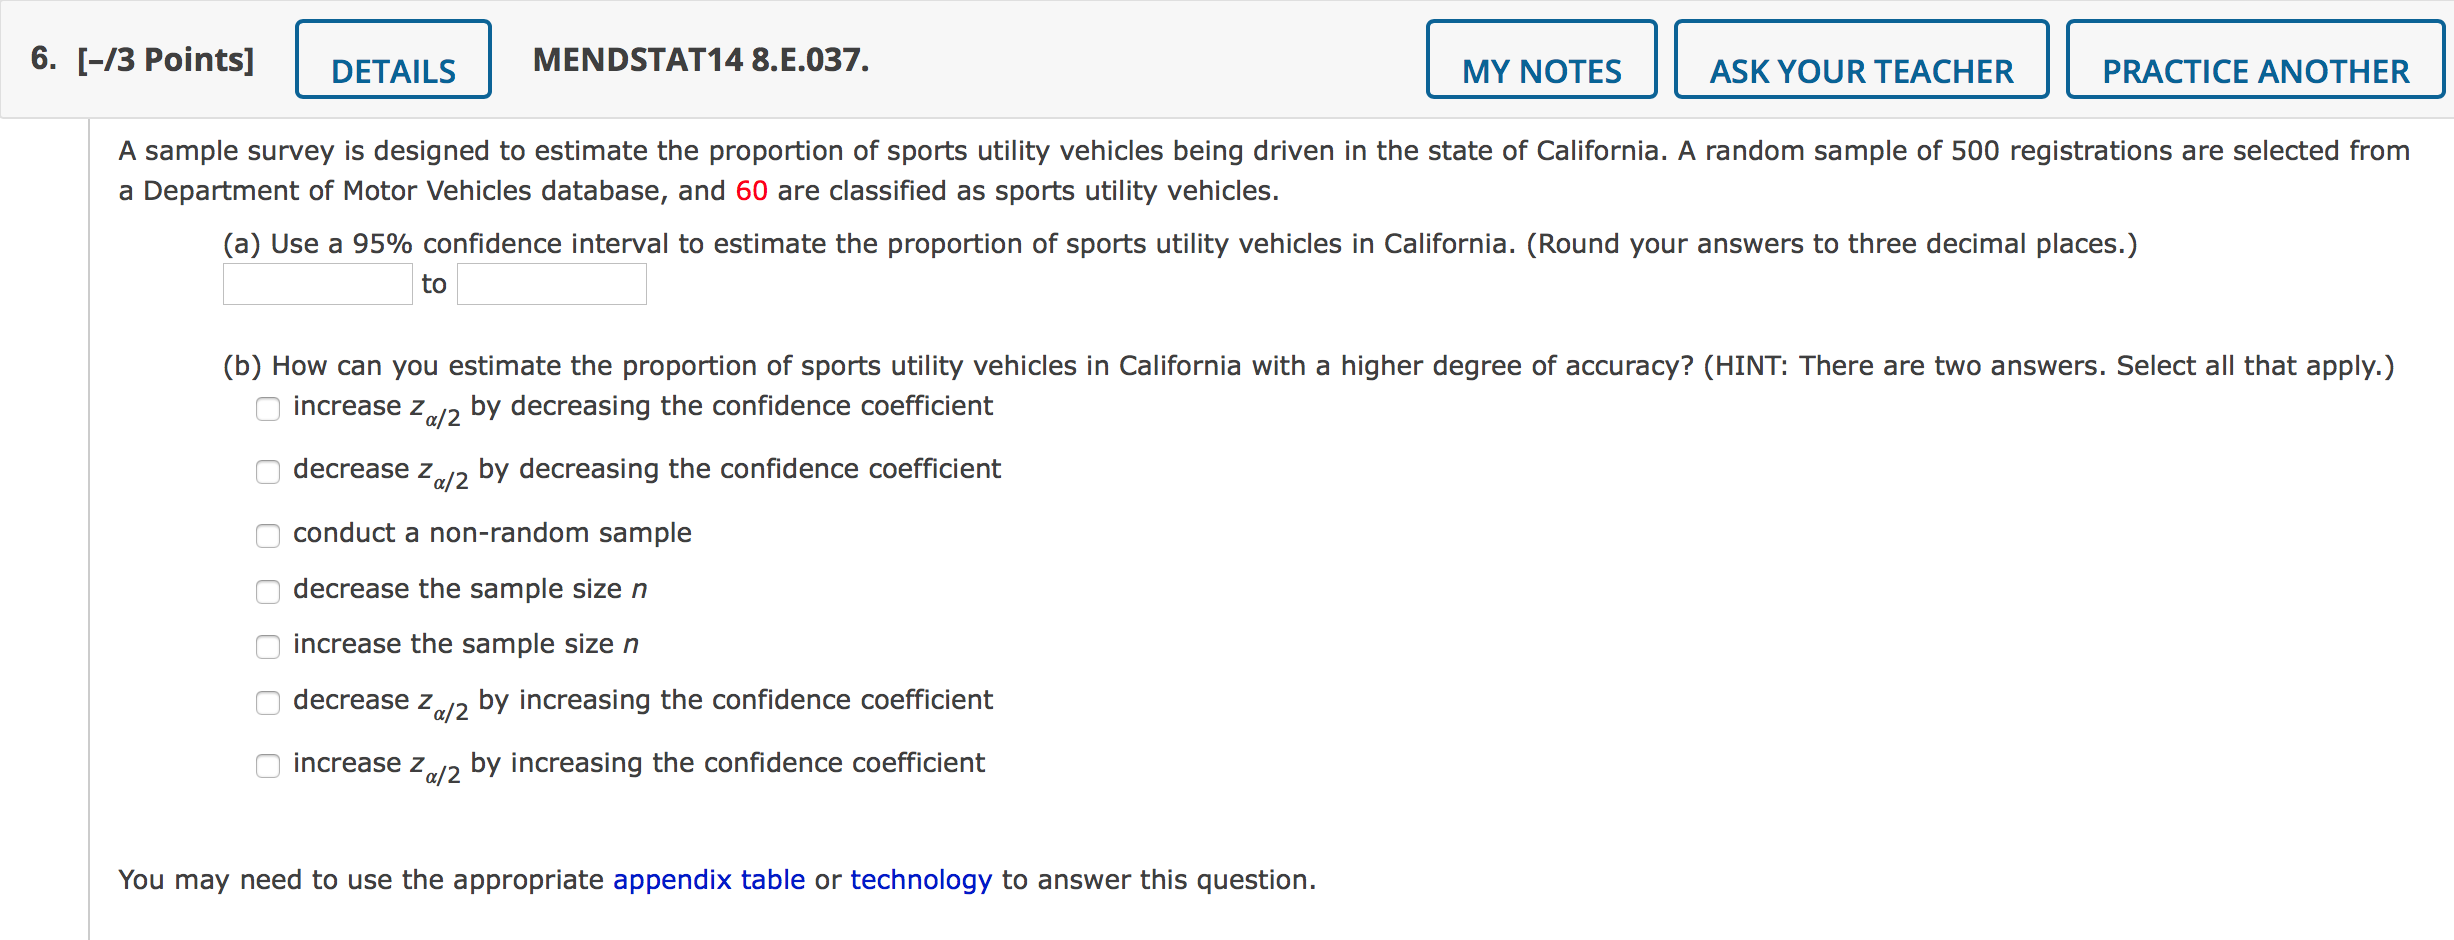
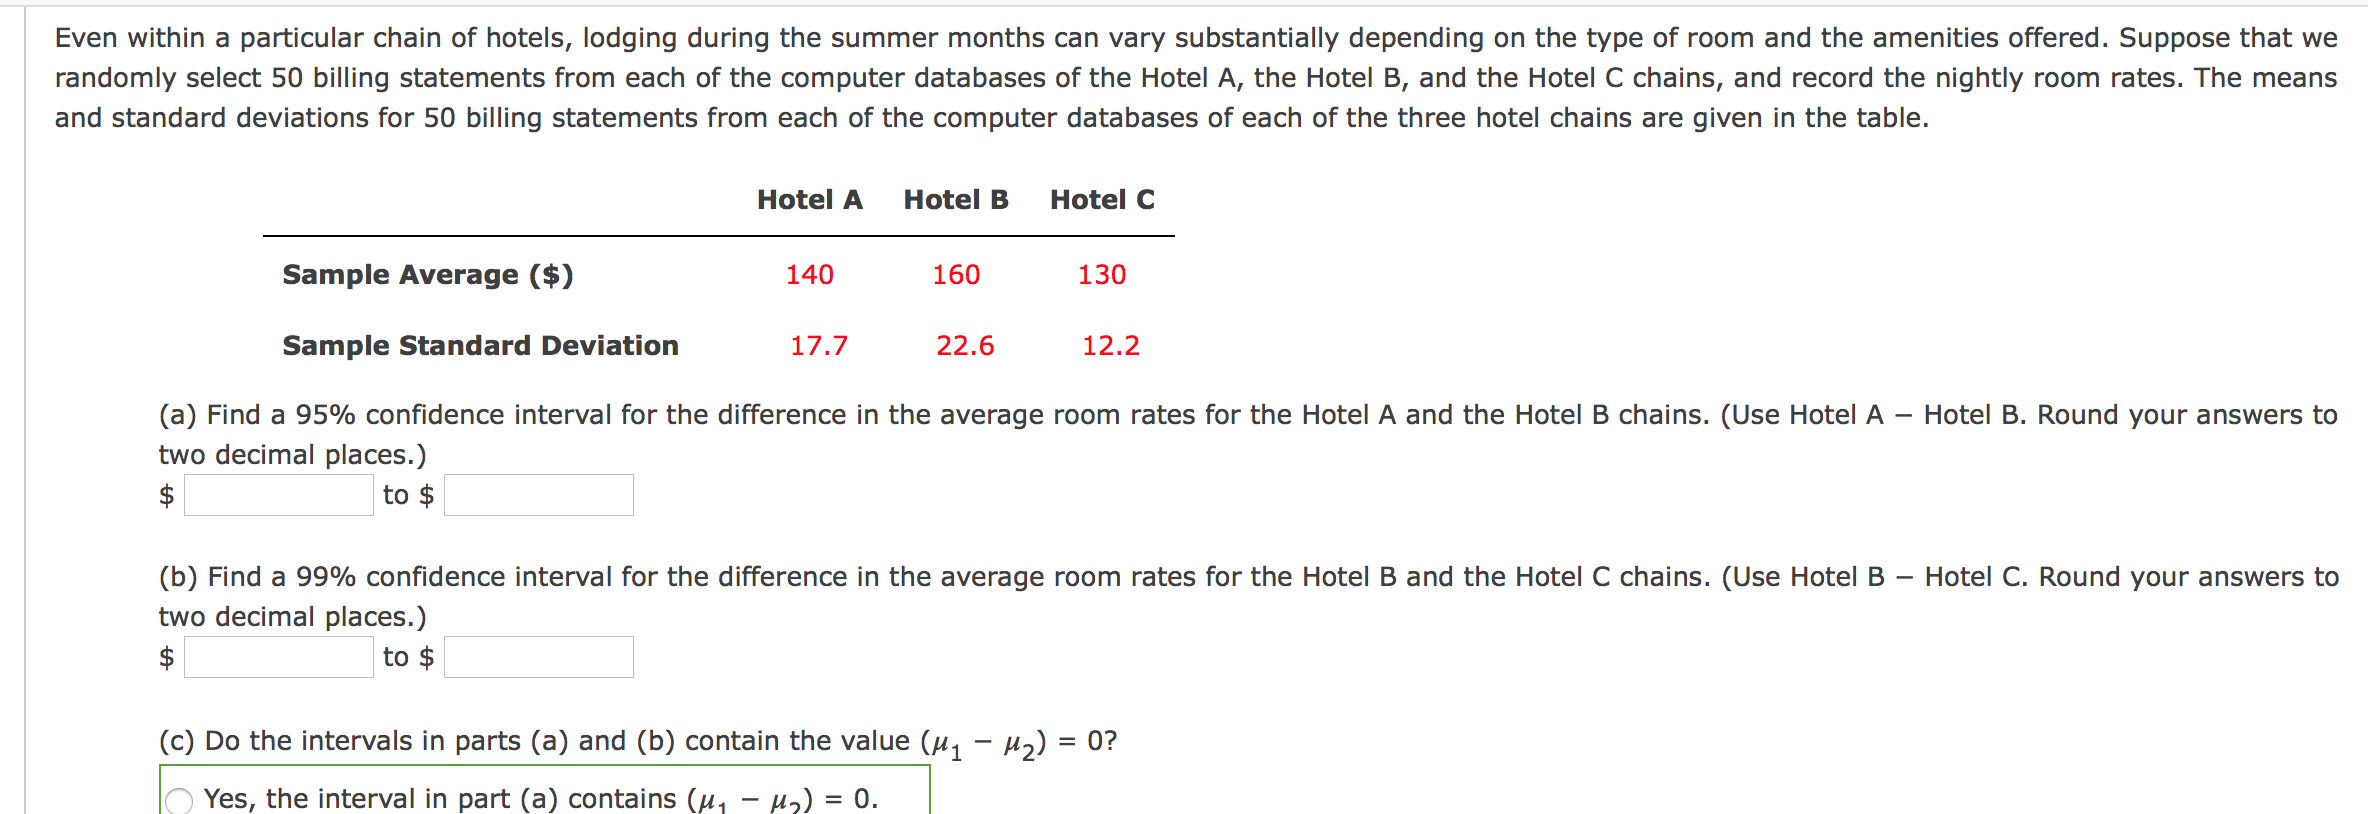
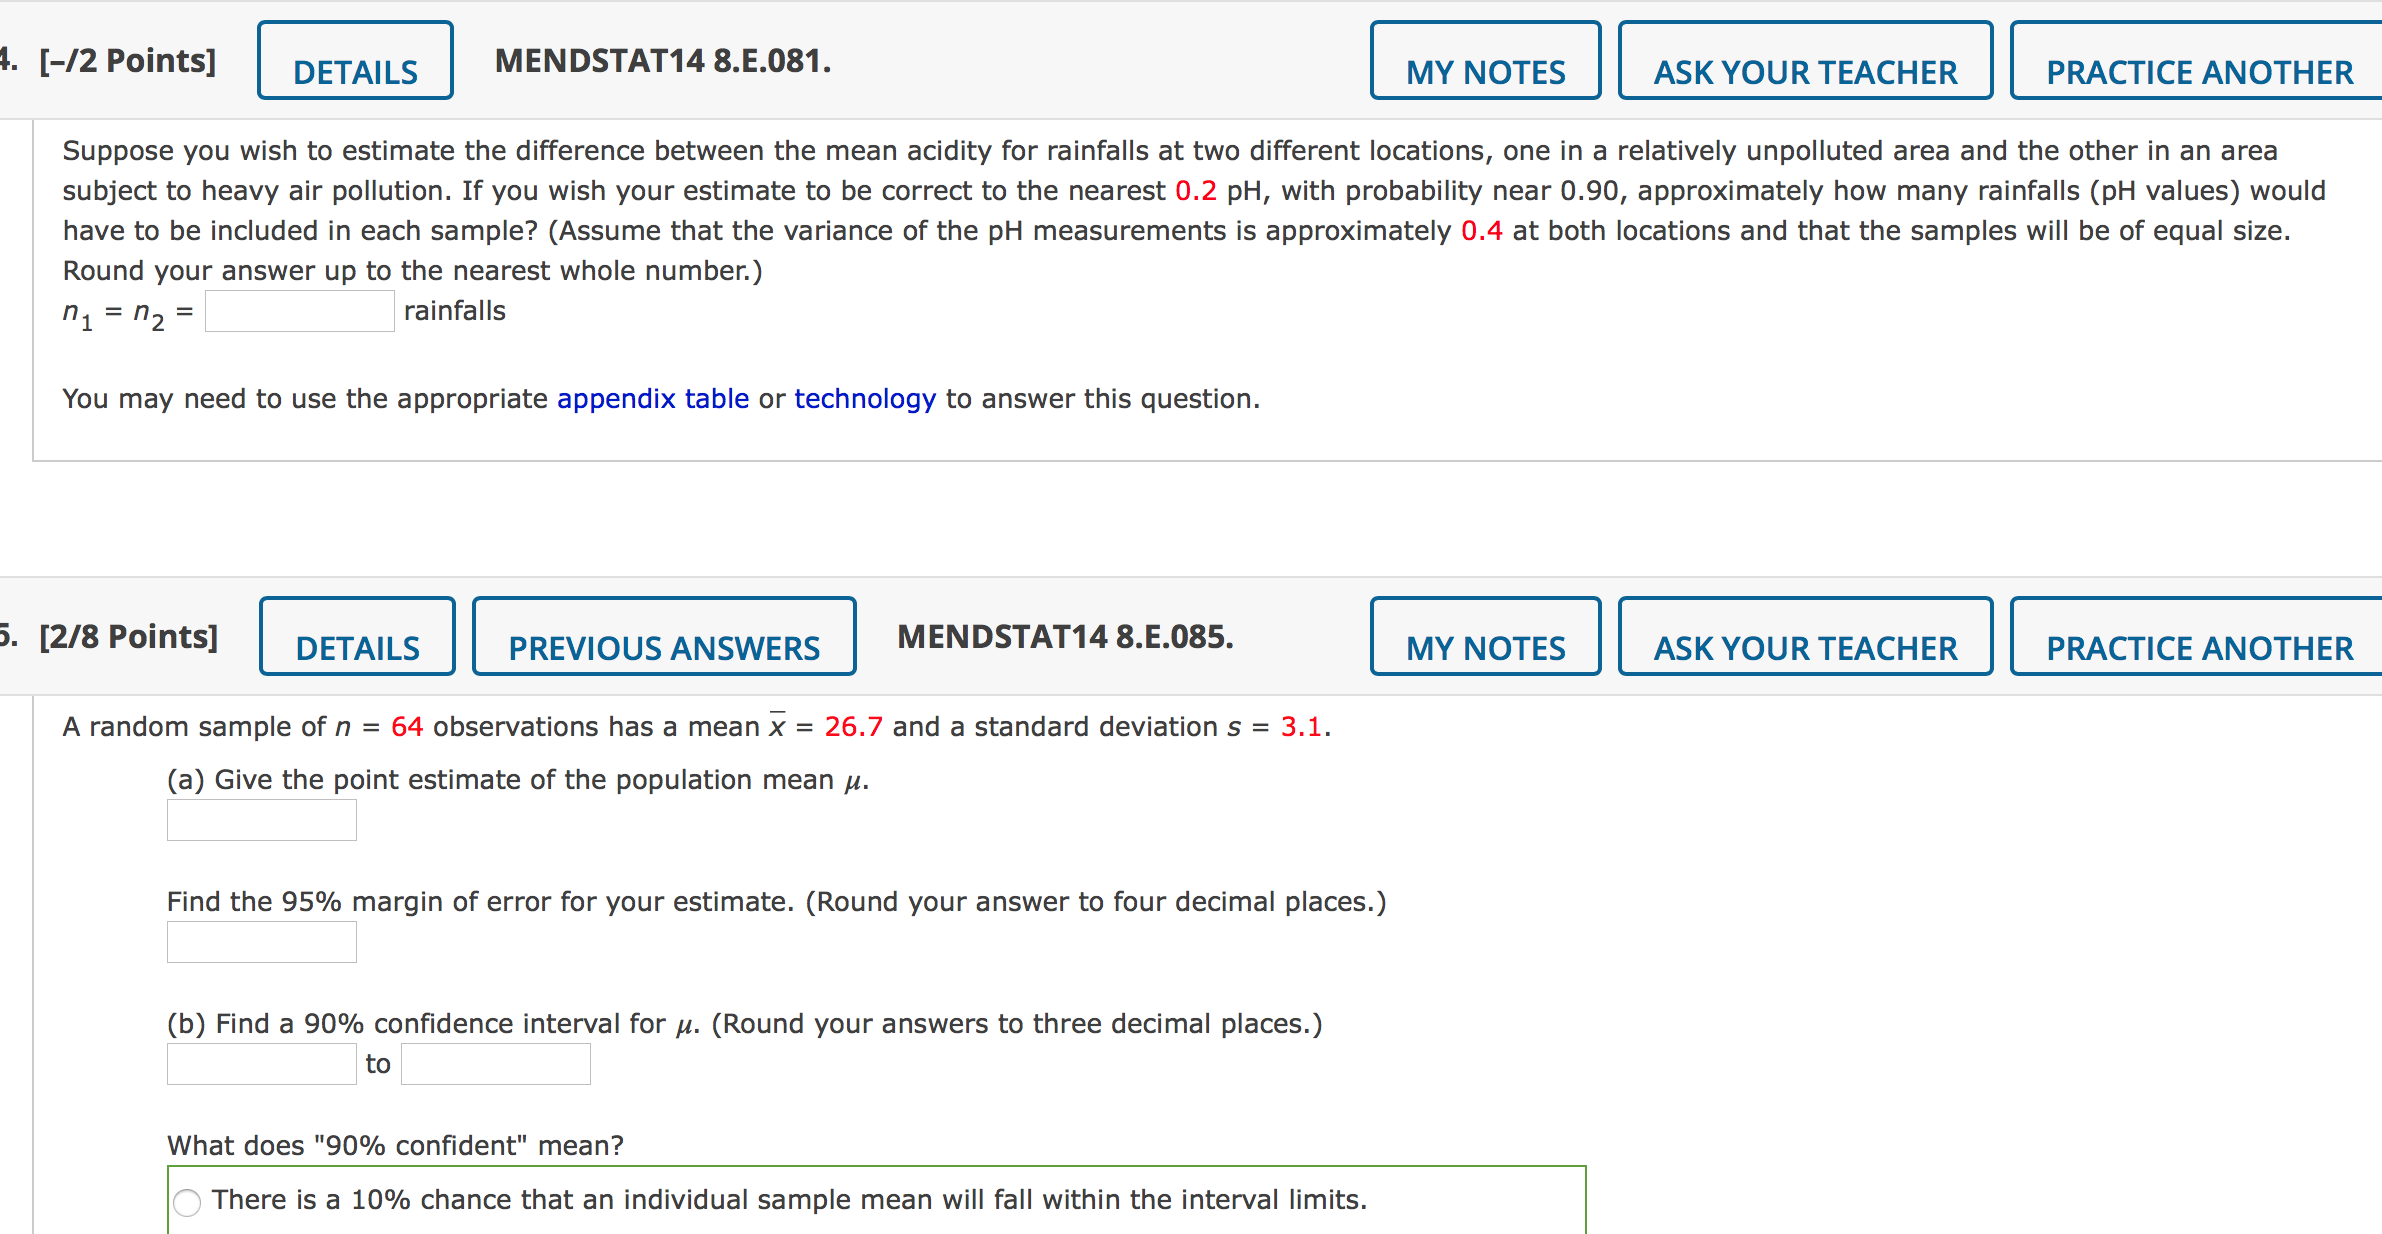
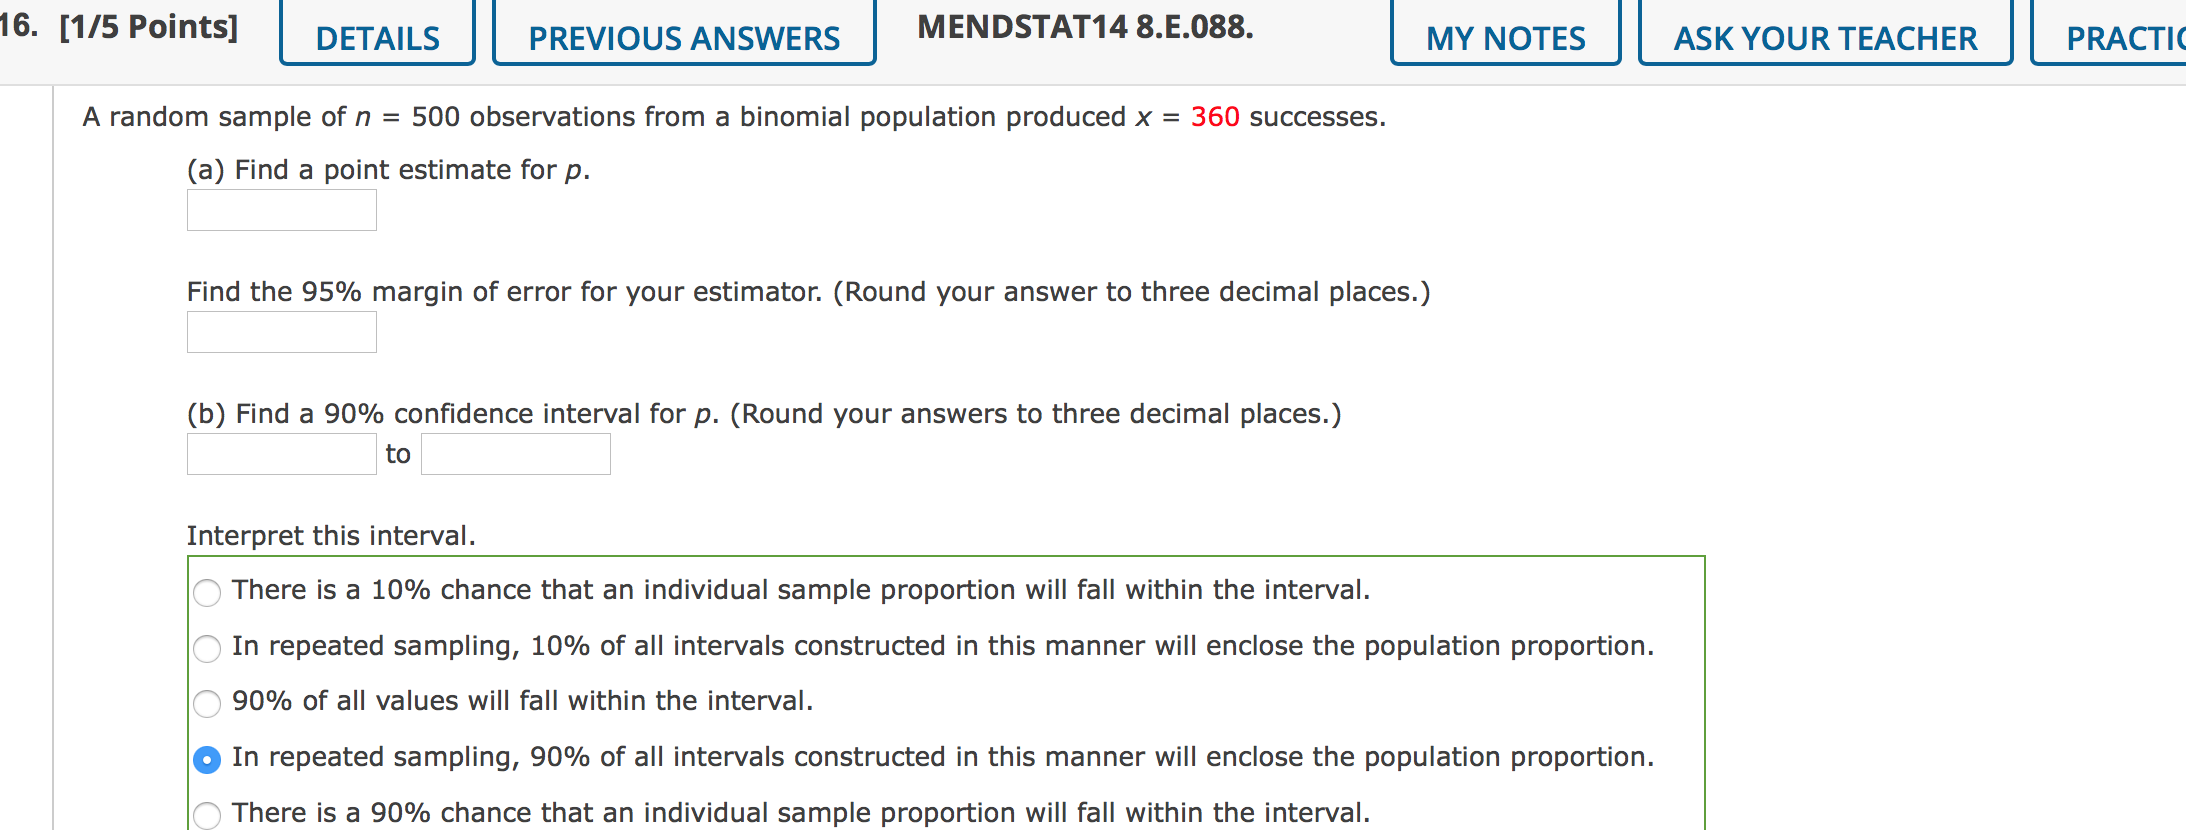
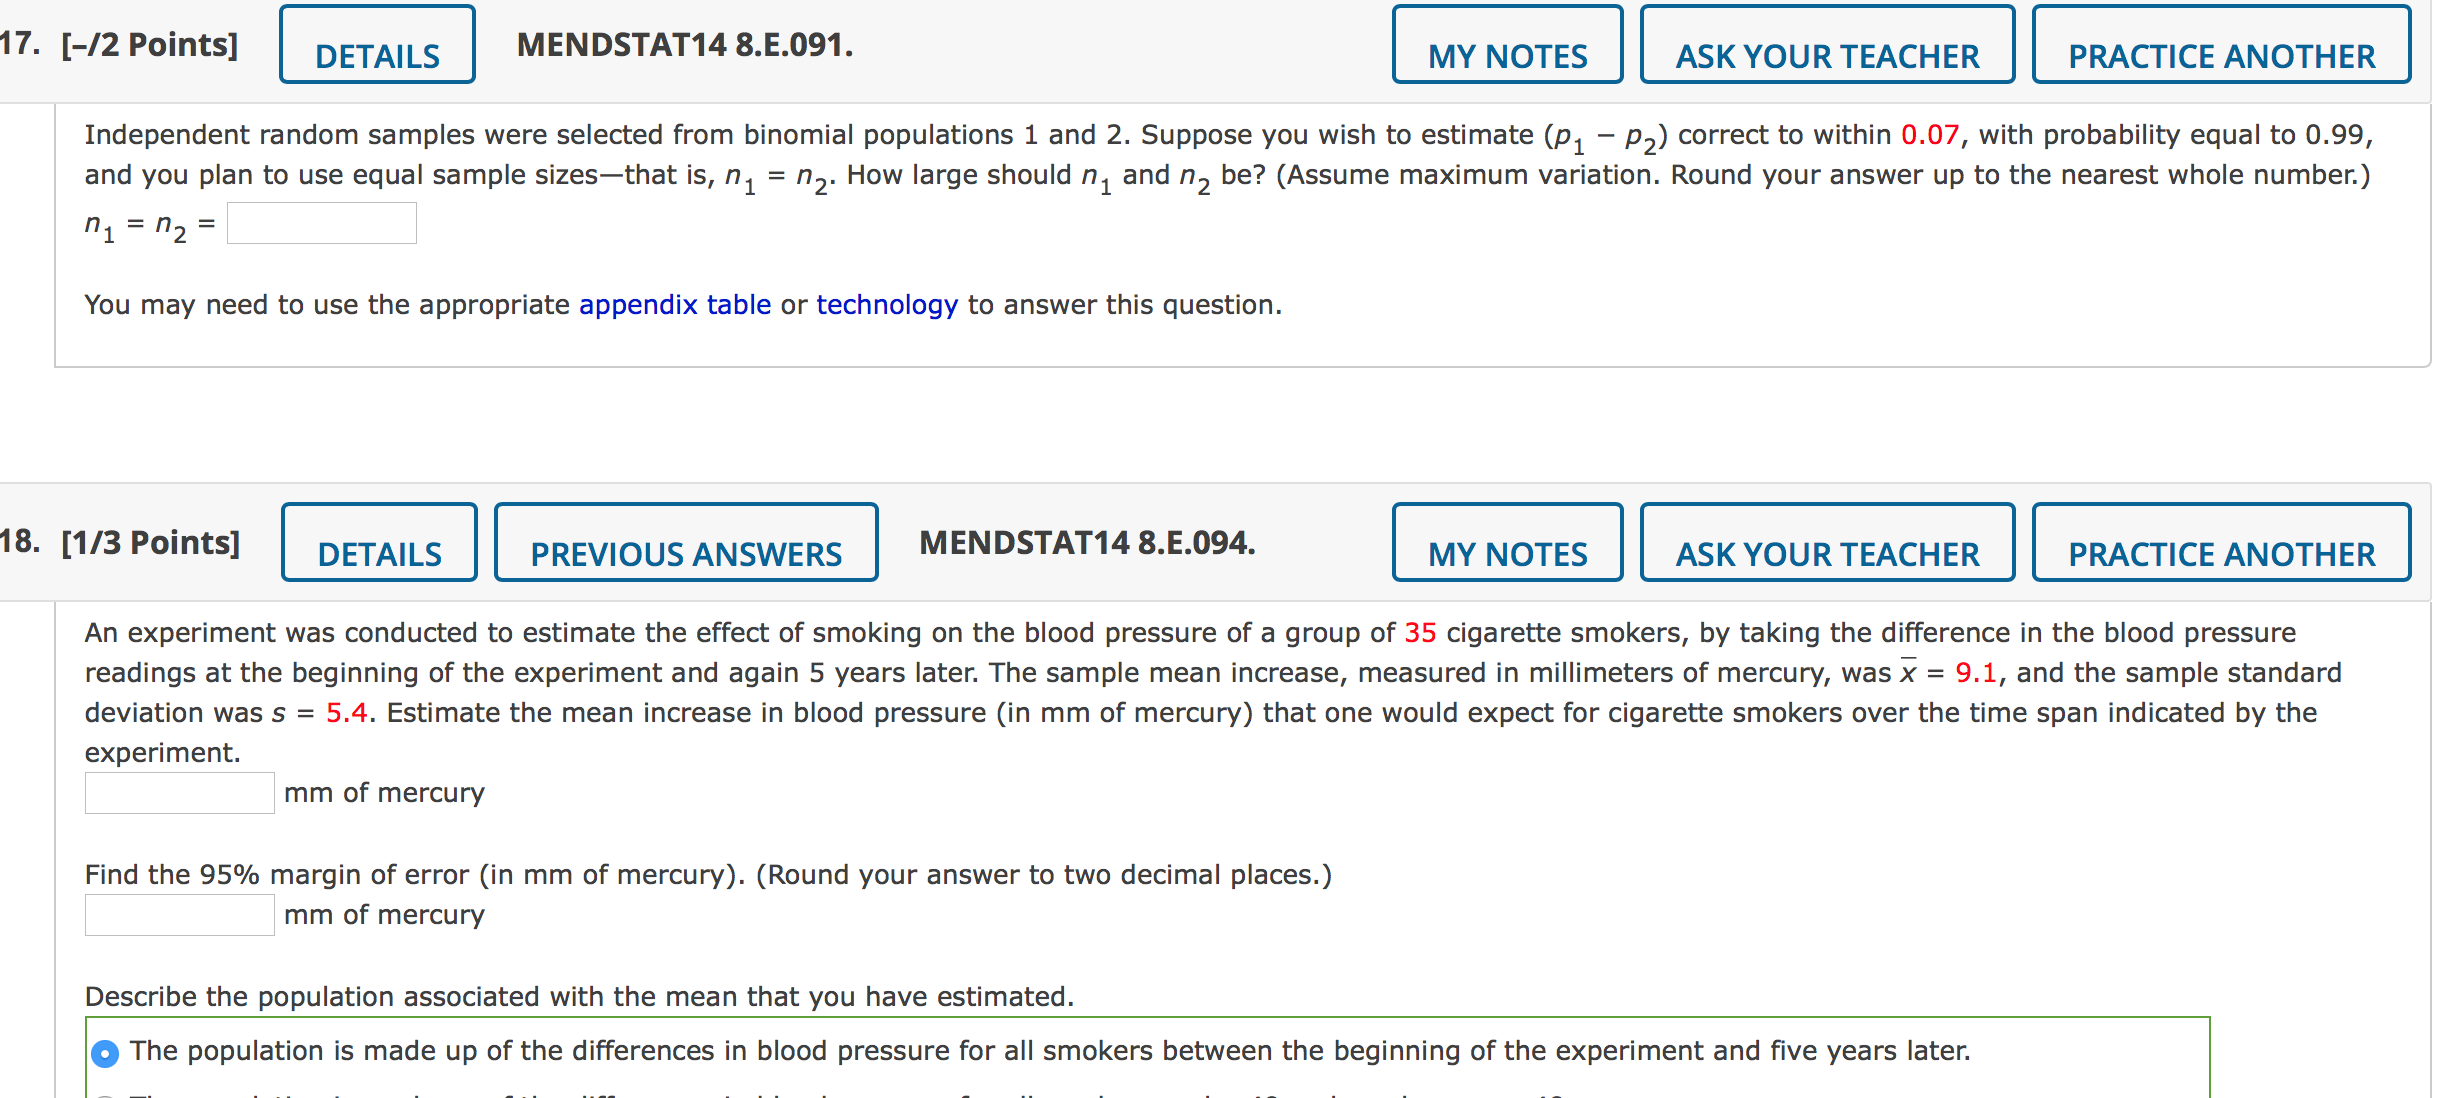
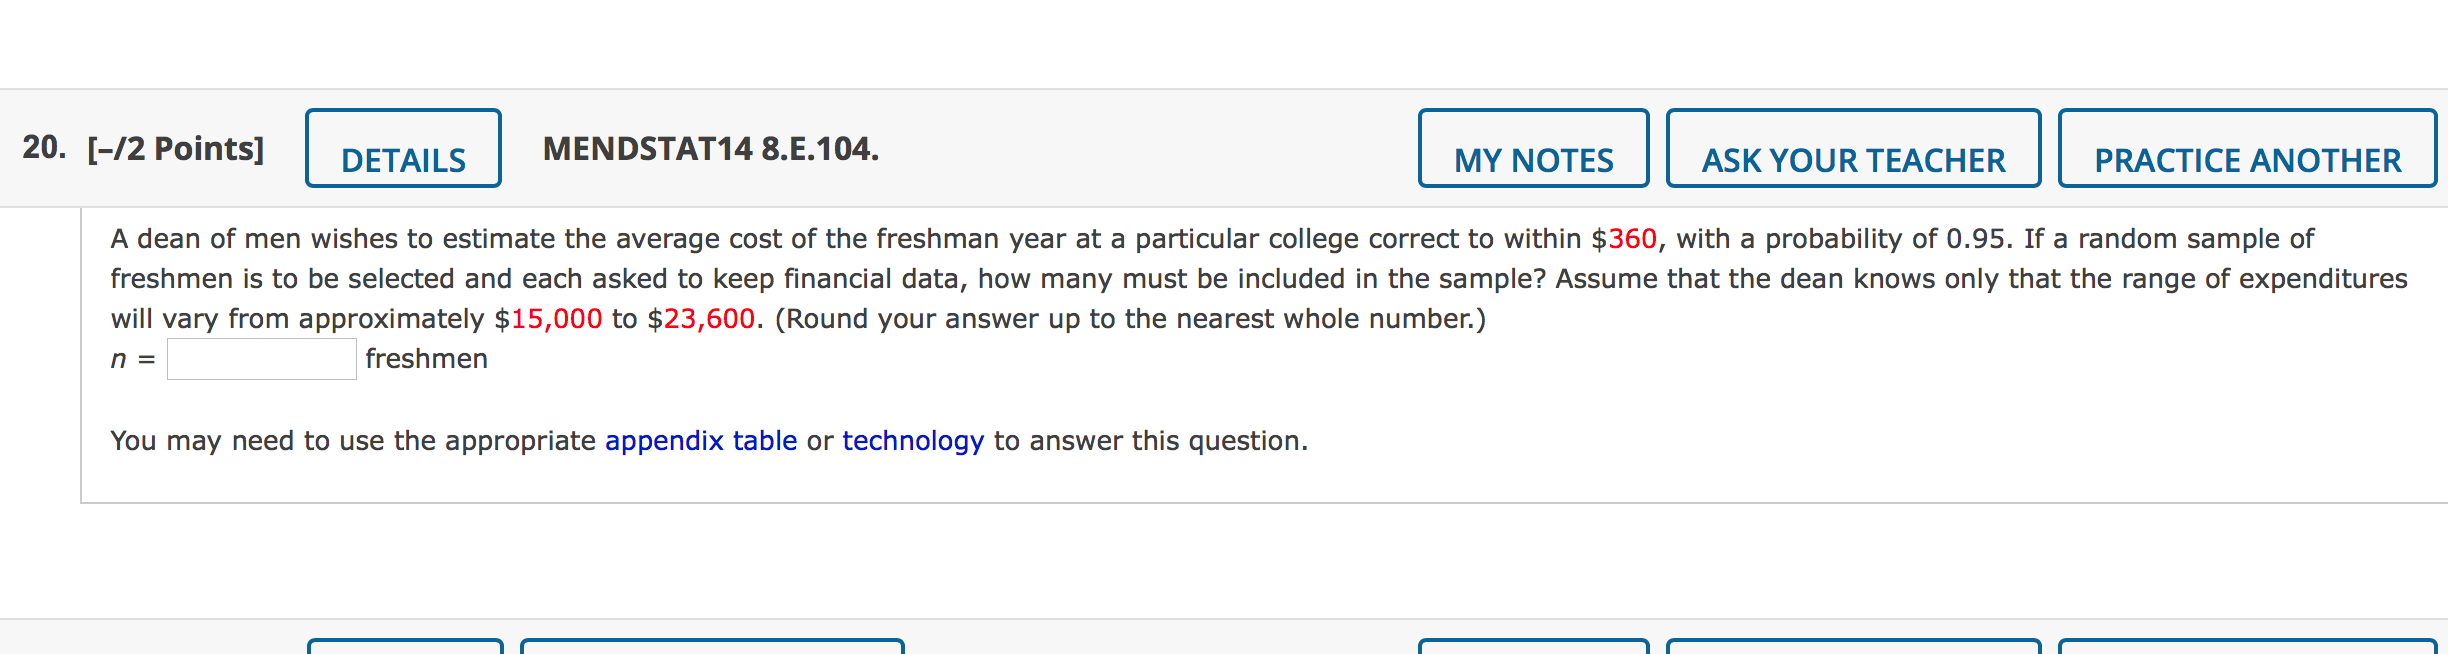
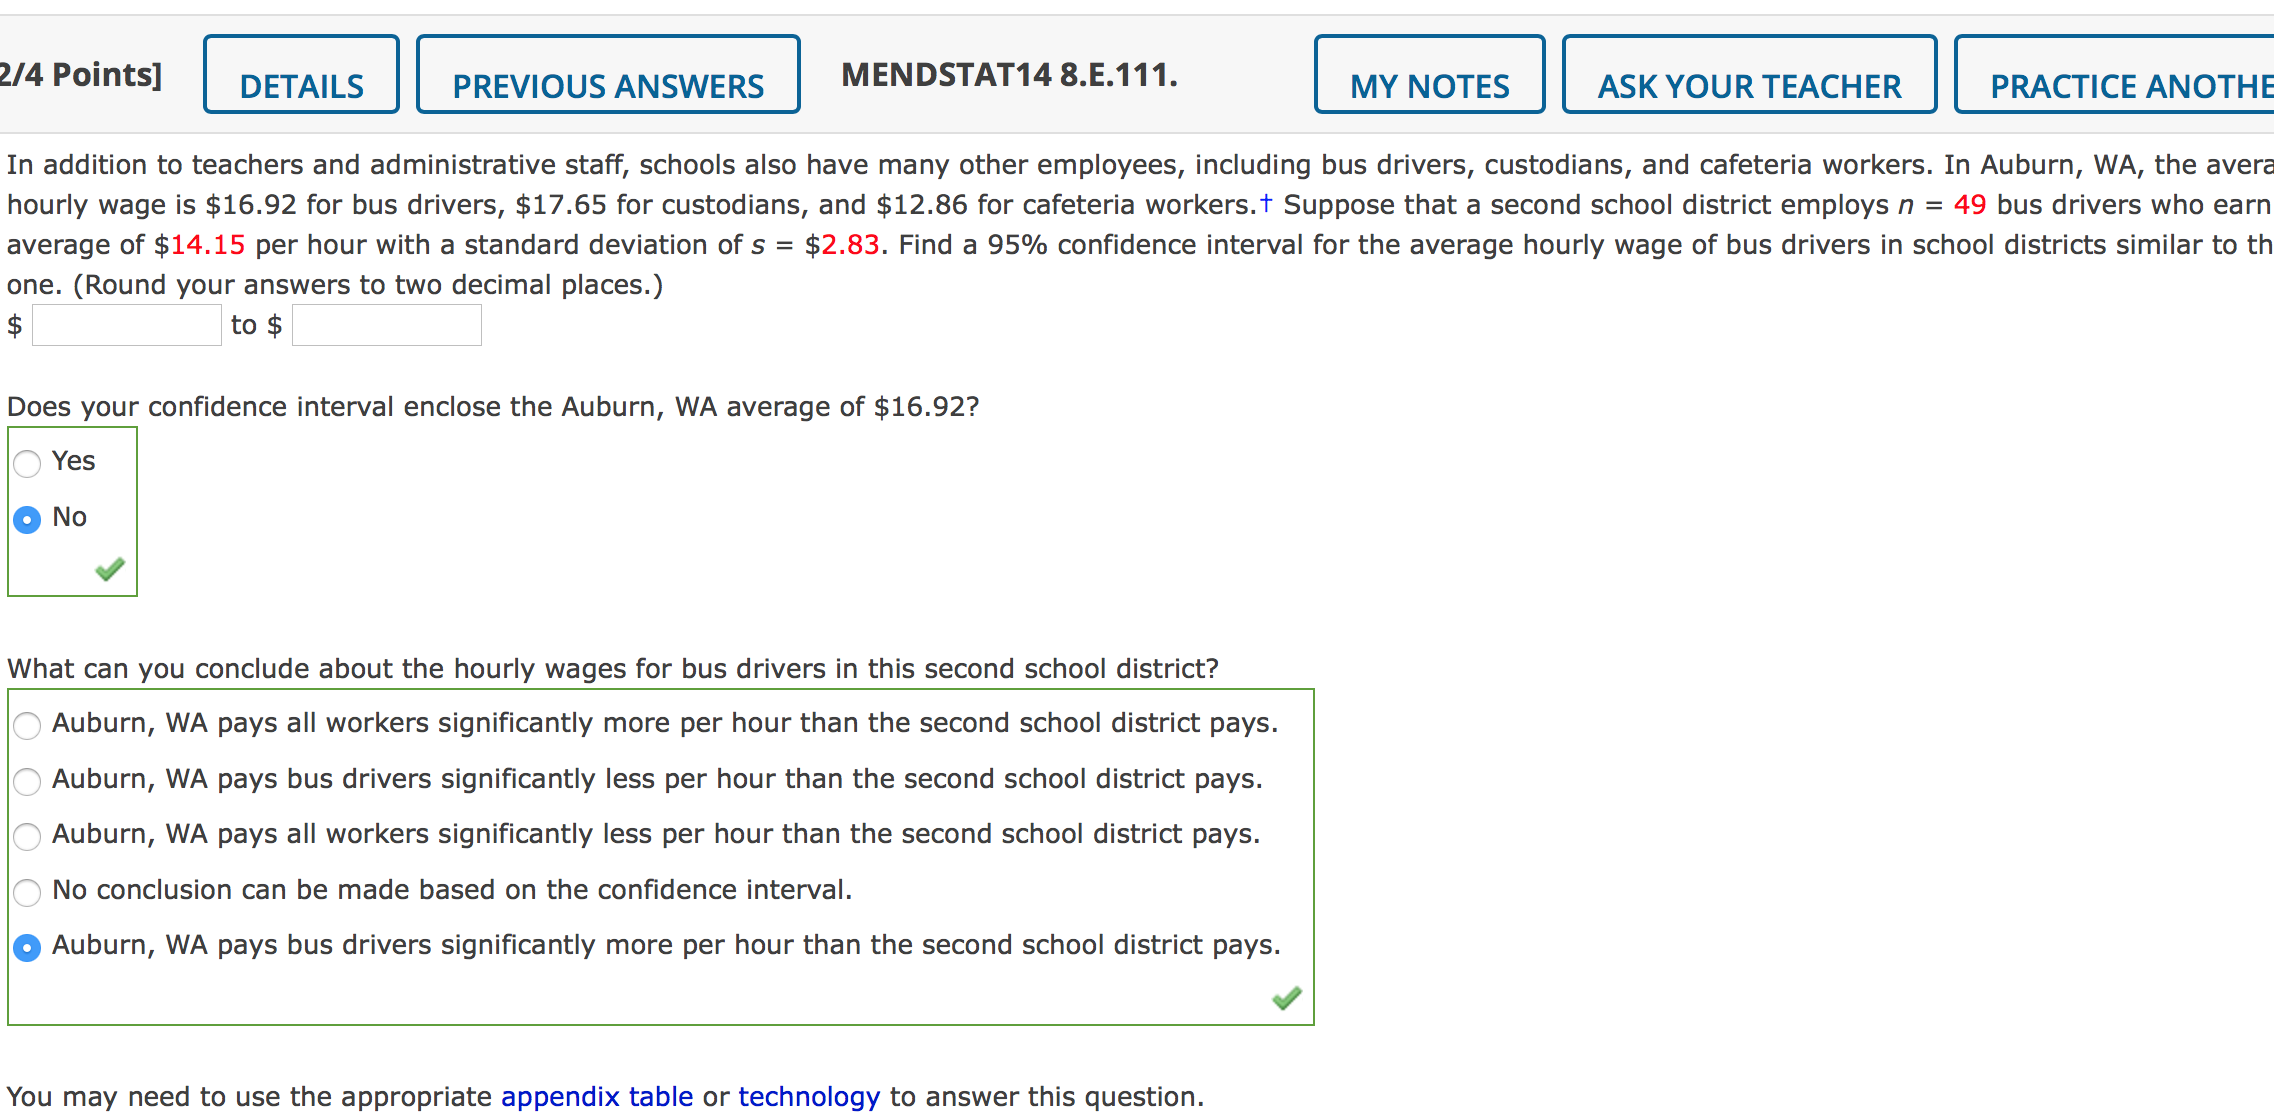
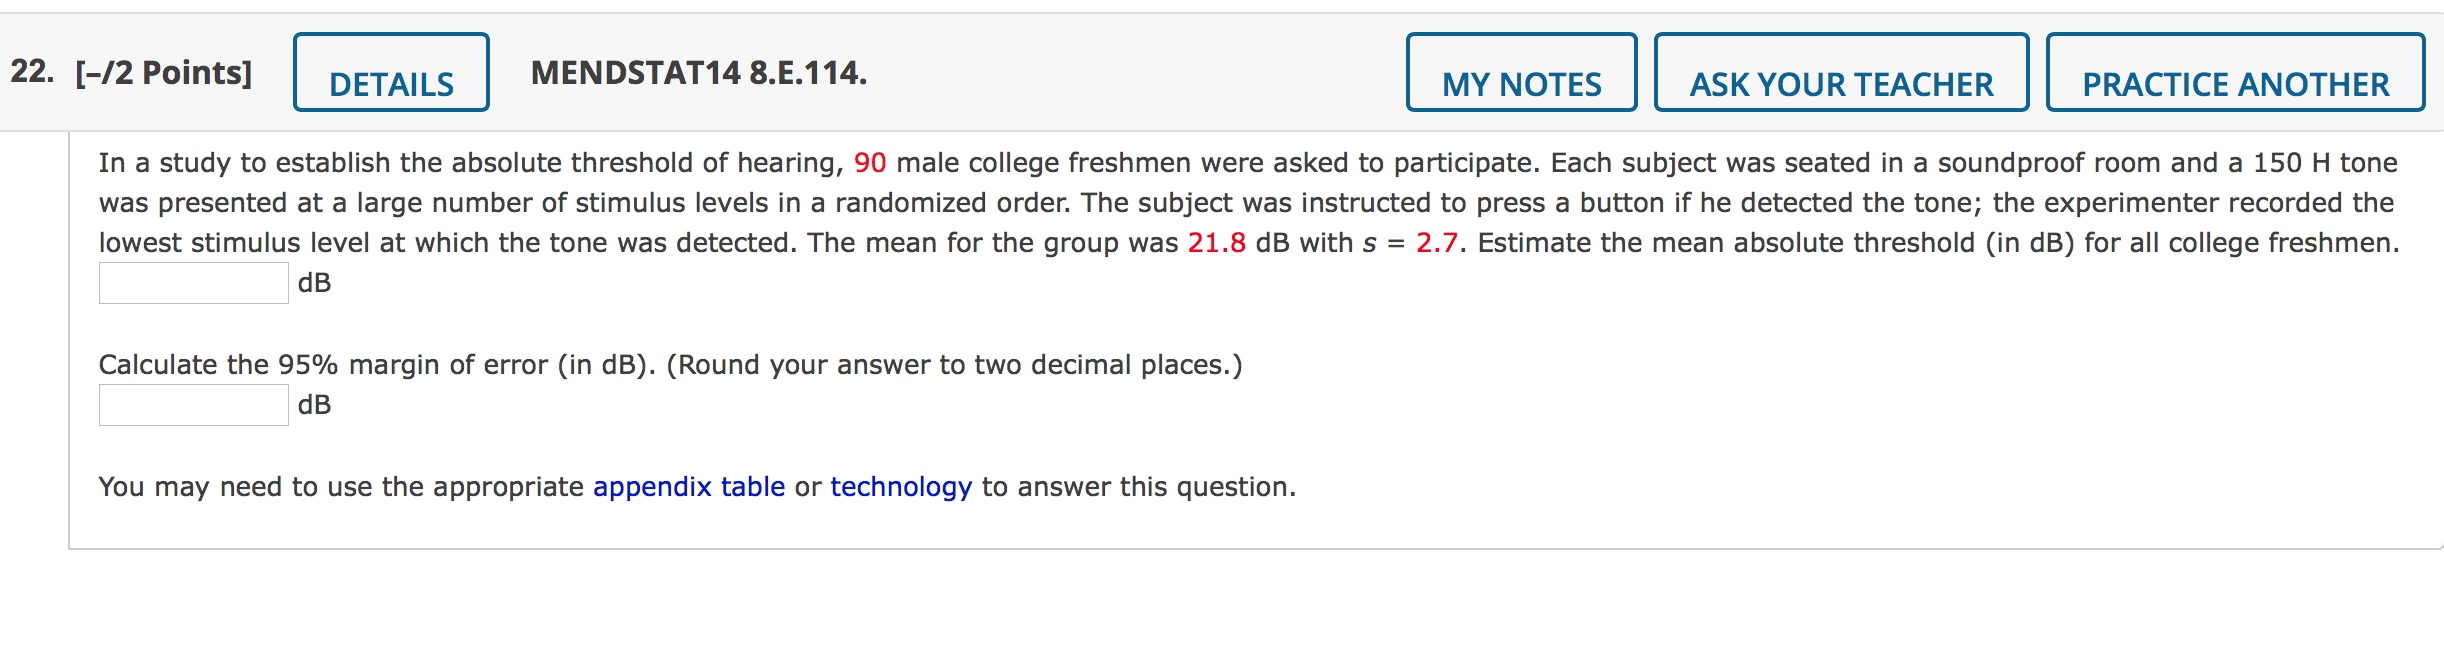
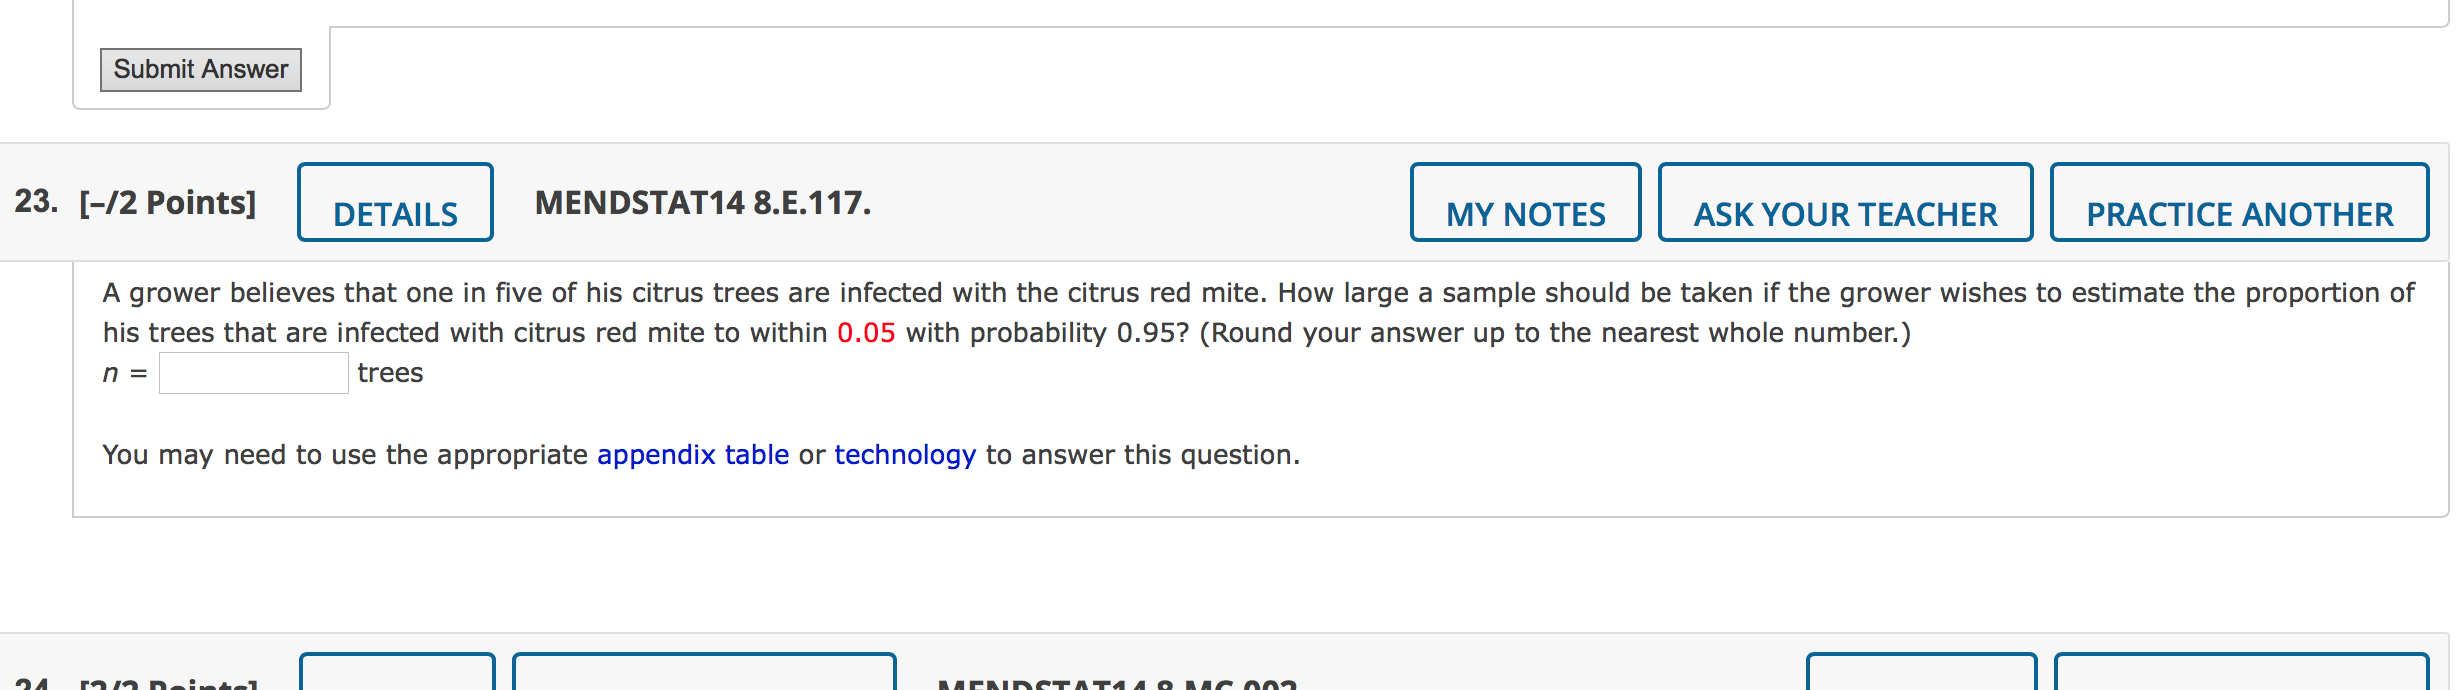
1. [2/4 Points] DETAILS PREVIOUS ANSWERS MENDSTAT14 8.E.007. MY NOTES ASK YOUR TEACHER PRACTICE ANOTHER Calculate the 95% margin of error in estimating a binomial proportion for each of the following values of n. Use p = 0.5 to calculate the standard error of the estimator. (Round your answers to three decimal places.) (a) n = 20 0.950 X (b) n = 200 0.069 (c) n = 600 (d) n = 1,000 0.031 You may need to use the appropriate appendix table or technology to answer this question.2- ""2 hints] DETAILS PREVIOUS ANSWERS MENDSTAT\" 8-5-017- MY NOTES ASK YOUR TEACHER | PRACTICE ANOTHER An increase in the rate of consumer savings is frequently tied to a lack of condence in the economy and is said to be an indicator of a recessional tendency in the economy. A random sampling ofn = 220 savings accounts in a local community showed a mean increase in savings account values of 7.9% over the past 12 months, with a standard deviation of 5.3%. Estimate the mean percent increase in savings account values over the past 12 months for depositors in the community. ' 0/0 Find the 95% margin of error (in %) for your estimate. (Round your answer to three decimal places.) lo.oo7 x % You may need to use the appropriate appendix table or technology to answer this question. 6. [-/3 Points] DETAILS MENDSTAT14 8.E.037. MY NOTES ASK YOUR TEACHER PRACTICE ANOTHER A sample survey is designed to estimate the proportion of sports utility vehicles being driven in the state of California. A random sample of 500 registrations are selected from a Department of Motor Vehicles database, and 60 are classified as sports utility vehicles. (a) Use a 95% confidence interval to estimate the proportion of sports utility vehicles in California. (Round your answers to three decimal places.) to (b) How can you estimate the proportion of sports utility vehicles in California with a higher degree of accuracy? (HINT: There are two answers. Select all that apply.) increase za/2 by decreasing the confidence coefficient O decrease za/2 by decreasing the confidence coefficient O conduct a non-random sample decrease the sample size n increase the sample size n O decrease za/2 by increasing the confidence coefficient O increase za/2 by increasing the confidence coefficient You may need to use the appropriate appendix table or technology to answer this question.Even within a particular chain of hotels, lodging during the summer months can vary substantially depending on the type of room and the amenities offered. Suppose that we randomly select 50 billing statements from each of the computer databases of the Hotel A, the Hotel B, and the Hotel C chains, and record the nightly room rates. The means and standard deviations for 50 billing statements from each of the computer databases of each of the three hotel chains are given in the table. Hotel A Hotel B Hotel C Sample Average ($) 140 160 130 Sample Standard Deviation 17.7 22.6 12.2 (a) Find a 95% confidence interval for the difference in the average room rates for the Hotel A and the Hotel B chains. (Use Hotel A - Hotel B. Round your answers to two decimal places.) $ to $ (b) Find a 99% confidence interval for the difference in the average room rates for the Hotel B and the Hotel C chains. (Use Hotel B - Hotel C. Round your answers to two decimal places.) $ to $ (c) Do the intervals in parts (a) and (b) contain the value (M1 - M2) = 0? Yes, the interval in part (a) contains (M, - M, ) = 0.ndependent random samples of 111 = 900 and n2 = 790 observations were selected from binomial populations 1 and 2, and X1 = 332 and X2 = 371 successes were observed. (a) Find a 90% condence interval for the difference (p1 p2) in the two population proportions. (Round your answers to three decimal places.) Q to ; Interpret the interval. A 90% of all differences in the two population proportions will fall within the interval. A In repeated sampling, 10% of all intervals constructed in this manner will enclose the true difference in population proportions. A There is a 10% chance that an individual difference in sample proportions will fall within the interval. A There is a 90% chance that an individual difference in sample proportions will fall within the interval. 0 In repeated sampling, 90% of all intervals constructed in this manner will enclose the true difference in population proportions. (b) What assumptions must you make for the condence interval to be valid? (Select all that apply.) A 111 + 112 > 1,000 A random samples A symmetrical distributions for both populations A 111') > 5 for samples from both populations A independent samples Q Hi] > 5 for samples from both populations Are these assumptions met? /3 Points] DETAILS PREVIOUS ANSWERS MENDSTAT14 8.E.063. MY NOTES ASK YOUR TEACHER PRACTICE ANOTHER In a study of the relationship between birth order and college success, an investigator found that 122 in a sample of 190 college graduates were firstborn or only children. In a sample of 100 nongraduates of comparable age and socioeconomic background, the number of firstborn or only children was 52. Estimate the difference between the proportions of firstborn or only children in the two populations from which these samples were drawn (P, - P2). Use a 90% confidence interval. (Use p , and P2 for the proportions of firstborn or only children who were college graduates and nongraduates, respectively. Round your answers to three decimal places.) to interpret your results. In repeated sampling, 90% of all intervals constructed in this manner will enclose the true value of P1 - P2. In repeated sampling, 10% of all intervals constructed in this manner will enclose the true value of P1 - P2. 90% of all proportions will fall within the interval. There is a 90% chance that a single difference in sample proportions will fall within the interval. There is a 10% chance that a single difference in sample proportions will fall within the interval. ou may need to use the appropriate appendix table or technology to answer this question.1. [-/4 Points] DETAILS MENDSTAT14 8.E.066. MY NOTES ASK YOUR TEACHER PRACTICE ANOTHER Last year's records of auto accidents occurring on a given section of highway were classified according to whether the resulting damage was $1,000 or more and to whether a physical injury resulted from the accident. The data follows. Under $1,000 $1,000 or More Number of Accidents 38 45 Number Involving Injuries 9 22 (a) Estimate the true proportion of accidents involving injuries when the damage was $1,000 or more for similar sections of highway. (Round your answer to three decimal places.) Find the 95% margin of error. (Round your answer to three decimal places.) (b) Estimate the true difference in the proportion of accidents involving injuries for accidents with damage under $1,000 and those with damage of $1,000 or more. Use a 95% confidence interval. (Use P, - P2 where p, is the proportion of accidents involving injuries with damage under $1,000 and p2 is the proportion of accidents involving injuries with damage of $1,000 or more. Round your answers to three decimal places.) to You may need to use the appropriate appendix table or technology to answer this question.12- [-I2 Points] DETAILS MENDSTAT\" 8-5-059- MY NOTES ASK YOUR TEACHER PRACTICE ANOTHER Independent random samples of size 30 are drawn from two quantitative populations, producing the sample information in the table. Sample 1 Sample 2 Sample Size 30 30 Sample Mean 14 11 Sample Standard Deviation 7 9 Find a 95% upper condence bound for the difference in the two population means (I41 I42). (Round your answer to two decimal places.) You may need to use the appropriate appendix table or technology to answer this question. 13- Hz mints] DETAILS MENDSTAT\" 8-E-72- MY NOTES ASK YOUR TEACHER PRACTICE ANOTHER Independent random samples of n1 = n2 = n observations are to be selected from each of two populations 1 and 2. If you wish to estimate the difference between the two population means correct to within 0.15, with probability equal to 0.90, how large should n1 and n2 be? Assume that you know 1712 z 0'22 z 21.3. (Round your answer up to the nearest whole number.) n1 = n2 = observations You may need to use the appropriate appendix table or technology to answer this question. '- ["2 Pintsl DETAILS MENDSTAT'\" 8-5-081- MY NOTES ASK YOUR TEACHER | PRACTICE ANOTHER Suppose you wish to estimate the difference between the mean acidity for rainfalls at two different locations, one in a relatively unpolluted area and the other in an area subject to heavy air pollution. If you wish your estimate to be correct to the nearest 0.2 pH, with probability near 0.90, approximately how many rainfalls (pH values) would have to be included in each sample? (Assume that the variance of the pH measurements is approximately 0.4 at both locations and that the samples will be of equal size. Round your answer up to the nearest whole number.) n1 = n2 = rainfalls You may need to use the appropriate appendix table or technology to answer this question. 5- [2'8 hints] DETAILS PREVIOUS ANSWERS MENDSTAT\" 8-5-035- MY NOTES ASK YOUR TEACHER | PRACTICE ANOTHER A random sample of n = 64 observations has a mean )7 = 26.7 and a standard deviation 5 = 3.1. (a) Give the point estimate of the population mean )4. Find the 95% margin of error for your estimate. (Round your answer to four decimal places.) (b) Find a 90% condence interval for M- (Round your answers to three decimal places.) to ,, What does "90% condent" mean? Q There is a 10% chance that an individual sample mean will fall within the interval limits. 16. [1/5 Points] DETAILS PREVIOUS ANSWERS MENDSTAT14 8.E.088. MY NOTES ASK YOUR TEACHER PRACTIC A random sample of n = 500 observations from a binomial population produced x = 360 successes. (a) Find a point estimate for p. Find the 95% margin of error for your estimator. (Round your answer to three decimal places.) (b) Find a 90% confidence interval for p. (Round your answers to three decimal places.) to Interpret this interval. There is a 10% chance that an individual sample proportion will fall within the interval. In repeated sampling, 10% of all intervals constructed in this manner will enclose the population proportion. O 90% of all values will fall within the interval. In repeated sampling, 90% of all intervals constructed in this manner will enclose the population proportion. O There is a 90% chance that an individual sample proportion will fall within the interval.17- Hz hints] DETAILS MENDSTAT\" 3-50\" MY NOTES ASK YOUR TEACHER PRACTICE ANOTHER Independent random samples were selected from binomial populations 1 and 2. Suppose you wish to estimate (p1 p2) correct to within 0.07, with probability equal to 0.99, and you plan to use equal sample sizesthat is, n1 = n2. How large should I11 and n2 be? (Assume maximum variation. Round your answer up to the nearest whole number.) n1=n2= You may need to use the appropriate appendix table or technology to answer this question. 13- \"'3 Mints] DET s PREVIOUS ANSWERS MENDSTAT\" 8-5-094- MY NOTES ASK YOUR TEACHER PRACTICE ANOTHER An experiment was conducted to estimate the effect of smoking on the blood pressure of a group of 35 cigarette smokers, by taking the difference in the blood pressure readings at the beginning of the experiment and again 5 years later. The sample mean increase, measured in millimeters of mercury, was )7 = 9.1, and the sample standard deviation was s = 5.4. Estimate the mean increase in blood pressure (in mm of mercury) that one would expect for cigarette smokers over the time span indicated by the experiment. mm of mercury Find the 95% margin of error (in mm of mercury). (Round your answer to two decimal places.) mm of mercury Describe the population associated with the mean that you have estimated. o The population is made up of the differences in blood pressure for all smokers between the beginning of the experiment and ve years later. 2"- [12 hints] DETAILS MENDSTAT\" 3-5-104- MY NOTES ASK YOUR TEACHER PRACTICE ANOTHER A dean of men wishes to estimate the average cost of the freshman year at a particular college correct to within $360, with a probability of 0.95. If a random sample of freshmen is to be selected and each asked to keep nancial data, how many must be included in the sample? Assume that the dean knows only that the range of expenditures will vary from approximately $15,000 to $23,600. (Round your answer up to the nearest whole number.) n = freshmen You may need to use the appropriate appendix table or technology to answer this question. 2/4 Points] DETAILS PREVIOUS ANSWERS MENDSTAT14 8.E. 111. MY NOTES ASK YOUR TEACHER PRACTICE ANOTHI In addition to teachers and administrative staff, schools also have many other employees, including bus drivers, custodians, and cafeteria workers. In Auburn, WA, the avera hourly wage is $16.92 for bus drivers, $17.65 for custodians, and $12.86 for cafeteria workers. Suppose that a second school district employs n = 49 bus drivers who earn average of $14.15 per hour with a standard deviation of s = $2.83. Find a 95% confidence interval for the average hourly wage of bus drivers in school districts similar to th one. (Round your answers to two decimal places.) $ to $ Does your confidence interval enclose the Auburn, WA average of $16.92? Yes No What can you conclude about the hourly wages for bus drivers in this second school district? O Auburn, WA pays all workers significantly more per hour than the second school district pays. O Auburn, WA pays bus drivers significantly less per hour than the second school district pays. O Auburn, WA pays all workers significantly less per hour than the second school district pays. No conclusion can be made based on the confidence interval. Auburn, WA pays bus drivers significantly more per hour than the second school district pays. You may need to use the appropriate appendix table or technology to answer this question.22- [-l2 Points] DETAILS MENDSTAT\" 3-5-114- MY NOTES ASK YOUR TEACHER PRACTICE ANOTHER In a study to establish the absolute threshold of hearing, 90 male college freshmen were asked to participate. Each subject was seated in a soundproof room and a 150 H tone was presented at a large number of stimulus levels in a randomized order. The subject was instructed to press a button if he detected the tone; the experimenter recorded the lowest stimulus level at which the tone was detected. The mean for the group was 21.8 dB with s = 2.7. Estimate the mean absolute threshold (in dB) for all college freshmen. dB Calculate the 95% margin of error (in dB). (Round your answer to two decimal places.) dB You may need to use the appropriate appendix table or technology to answer this question. \fSubmit Answer 23. [-/2 Points] DETAILS MENDSTAT14 8.E. 117. MY NOTES ASK YOUR TEACHER PRACTICE ANOTHER A grower believes that one in five of his citrus trees are infected with the citrus red mite. How large a sample should be taken if the grower wishes to estimate the proportion of his trees that are infected with citrus red mite to within 0.05 with probability 0.95? (Round your answer up to the nearest whole number.) n = trees You may need to use the appropriate appendix table or technology to answer this