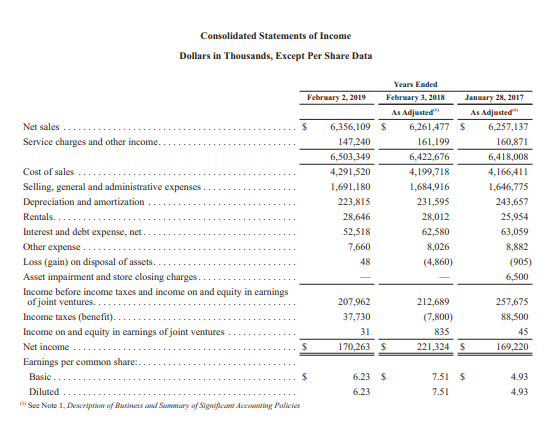
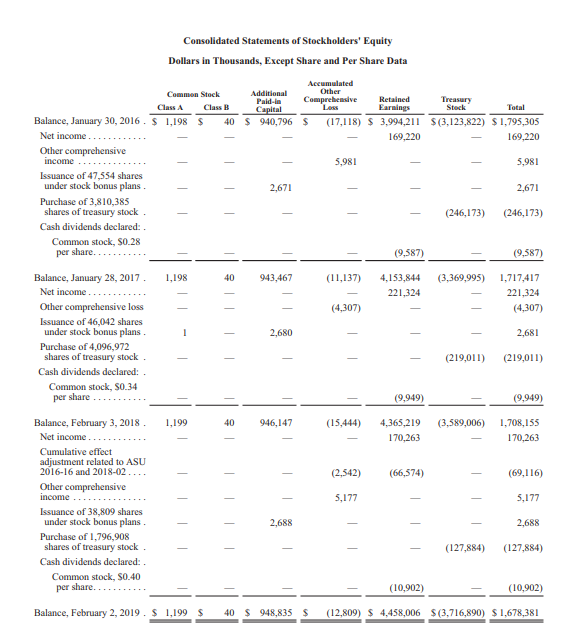
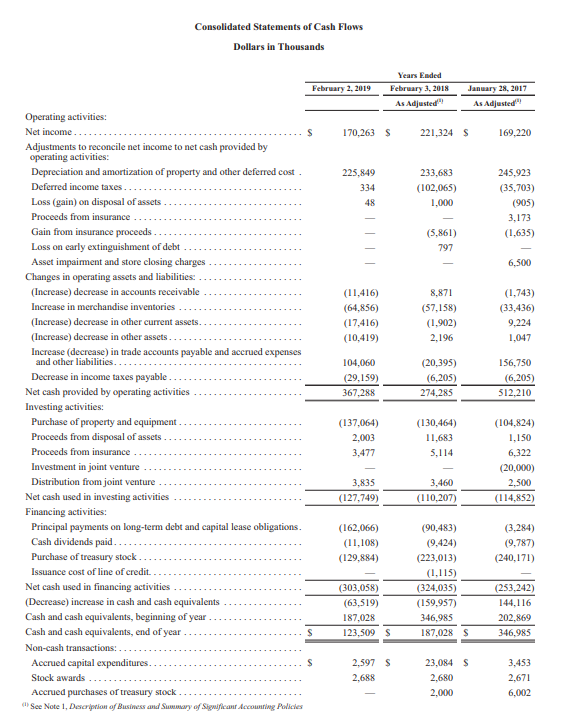
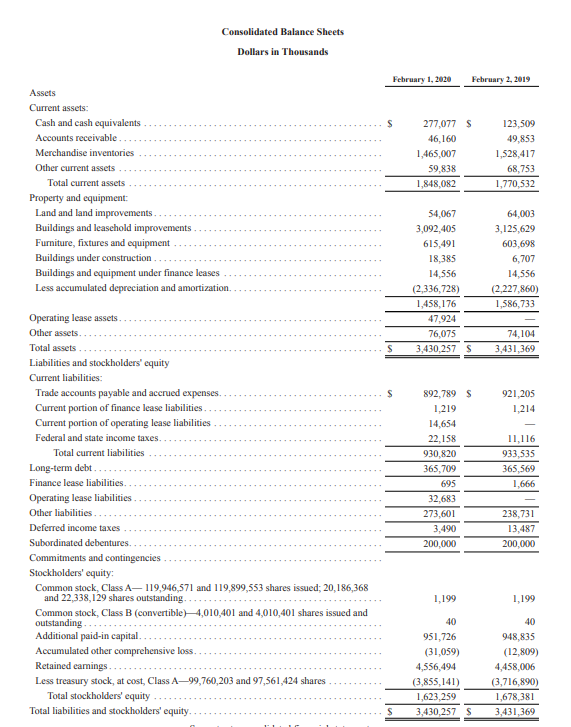
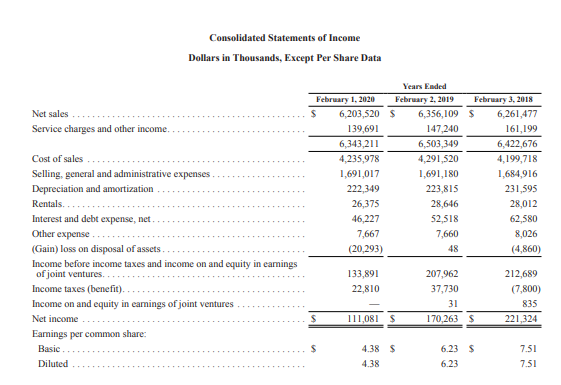
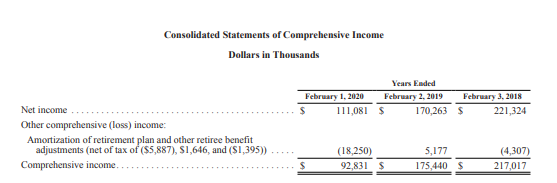
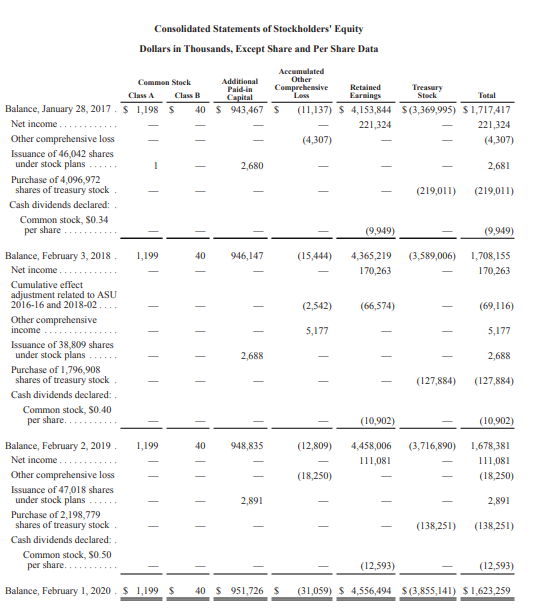
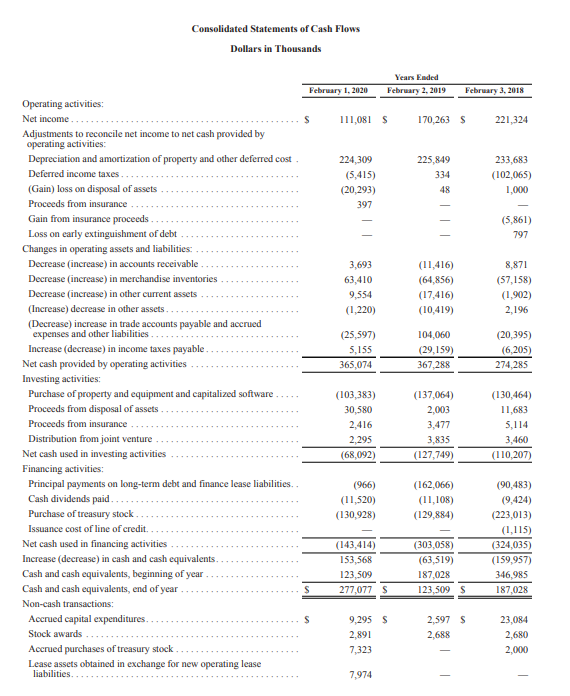
Please help me with these ratios for the years available. Thank you!
- Working capital
- Current ratio
- Quick ratio
- Accounts receivable turnover (assume all sales are credit sales)
- Average days to collect receivables
- Inventory turnover
- Average days to sell inventory
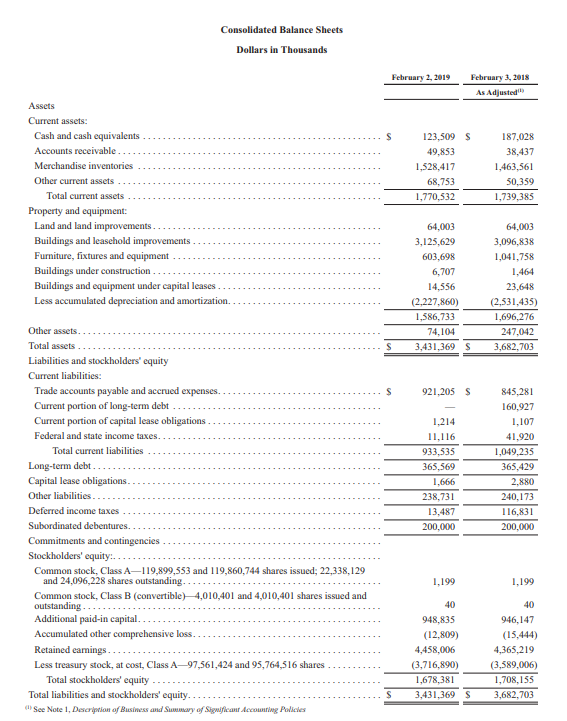
Consolidated Balance Sheets Dollars in Thousands February 2, 2019 February 3, 2018 As Adjusted 123,509 s 49,853 1,528,417 68,753 1.770,532 187,028 38,437 1,463,561 50,359 1.739,385 Assets Current assets: Cash and cash equivalents Accounts receivable... Merchandise inventories Other current assets Total current assets Property and equipment: Land and land improvements. Buildings and leasehold improvements Furniture, fixtures and equipment Buildings under construction Buildings and equipment under capital leases Less accumulated depreciation and amortization.. 64,003 3,125,629 603,698 6,707 14,556 (2,227,860) 1,586,733 74,104 3,431,369 $ 64,003 3,096,838 1,041,758 1,464 23,648 (2,531,435) 1,696,276 247,042 3,682,703 S 921,205 S Other assets.. Total assets Liabilities and stockholders' equity Current liabilities: Trade accounts payable and accrued expenses. Current portion of long-term debt Current portion of capital lease obligations Federal and state income taxes. Total current liabilities Long-term debt.... Capital lease obligations Other liabilities Deferred income taxes Subordinated debentures. Commitments and contingencies Stockholders' equity... Common stock, Class A-119,899,553 and 119,860,744 shares issued; 22,338,129 and 24,096,228 shares outstanding. Common stock, Class B (convertible) 4,010,401 and 4,010,401 shares issued and outstanding... Additional paid-in capital Accumulated other comprehensive loss. Retained carings Less treasury stock, at cost, Class A-97,561,424 and 95,764,516 shares Total stockholders' equity Total liabilities and stockholders' equity. See Note 1, Description of Business and Summary of Significant Accounting Policies 1,214 11.116 933,535 365,569 1,666 238,731 13,487 200.000 845,281 160.927 1.107 41.920 1,049,235 365,429 2,880 240.173 116,831 200,000 1,199 1,199 40 40 948.835 (12.809) 4,458,006 (3,716,890) 1,678,381 3,431,369 $ 946, 147 (15,444) 4,365,219 (3,589,006) 1,708,155 3,682,703 Consolidated Statements of Income Dollars in Thousands, Except Per Share Data Years Emded February 2, 2019 February 3, 2018 January 28, 2017 As Adjusted" As Adjusted" Net sales s 6,356,109 $ 6,261,477 $ 6,257,137 Service charges and other income.. 147,240 161,199 160,871 6,503,349 6,422,676 6,418,008 Cost of sales 4,291,520 4,199,718 4,166,411 Selling, general and administrative expenses 1,691,180 1,684,916 1,646,775 Depreciation and amortization 223,815 231,595 243,657 Rentals... 28,646 28,012 25,954 Interest and debt expense, net 52,518 62,580 63,059 Other expense 7,660 8,026 8,882 Loss (gain) on disposal of assets. 48 (4,860) (905) Asset impairment and store closing charges. 6,500 Income before income taxes and income on and equity in earings of joint ventures... 207,962 212,689 257,675 Income taxes (benefit)... 37,730 (7.800) 88,500 Income on and equity in earnings of joint ventures 31 835 45 Net income.. 170,263 $ 221,324 169,220 Earnings per common share: Basie $ 6.23 $ 7.51 $ 4.93 Diluted 6.23 7.51 4.93 See Note 1, Description of Business and Stary of Significan Accowwing Policies Consolidated Statements of Comprehensive Income Dollars in Thousands Years Emded February 2, 2019 February 3, 2018 January 28, 2017 170,263 $ 221,324 $ 169,220 Net income Other comprehensive income (loss): Amortization of retirement plan and other retiree benefit adjustments (net of tax of $1,646, ($1,395) and $3,686) Comprehensive income. 5.177 175,440 $ (4,307) 217,017 $ 5,981 175,201 Consolidated Statements of Stockholders' Equity Dollars in Thousands, Except Share and Per Share Data Accumulated Common Stock Additional Other Paid-la Comprehensive Retained Treasury Class A Class B Capital Loss Earnings Stock Total Balance, January 30, 2016. $ 1,198 $ 40 $ 940,796 $ (17,118) $ 3,994,211 $(3,123,822) $ 1,795,305 Net income 169,220 169,220 Other comprehensive income 5,981 5,981 Issuance of 47,554 shares under stock bonus plans 2,671 2,671 Purchase of 3,810,385 shares of treasury stock (246,173) (246,173) Cash dividends declared: Common stock, S0.28 per share... (9,587) (9,587) - 1,198 40 943,467 (11,137) (3,369,995) 4.153,844 221,324 1,717,417 221,324 (4,307) (4,307) Balance, January 28, 2017 Net income.. Other comprehensive loss Issuance of 46,042 shares under stock bonus plans. Purchase of 4,096,972 shares of treasury stock. Cash dividends declared: Common stock, $0.34 2,680 2,681 - (219,011) (219,011) per share (9,949) (9,949) 1,199 40 946,147 (15,444) 4,365,219 170,263 (3,589,006) 1,708,155 170,263 - (2,542) (66,574) (69,116) Balance, February 3, 2018 Net income.. Cumulative effect adjustment related to ASU 2016-16 and 2018-02 Other comprehensive income Issuance of 38,809 shares under stock bonus plans. Purchase of 1,796,908 shares of treasury stock Cash dividends declared: Common stock, 50.40 5,177 5,177 2,688 2,688 (127,884) (127,884) per share. (10,902) (10,902) Balance, February 2, 2019. $ 1,199 $ 40 $948,835 $ (12,809) $ 4,458,006 $ (3,716,890) $ 1,678,381 Consolidated Statements of Cash Flows Dollars in Thousands February 2, 2019 Years Emded February 3, 2018 As Adjusted January 28, 2017 As Adjusted 170,263 s 221,324 S 169,220 225,849 334 48 233,683 (102,065) 1,000 245,923 (35,703) (905) 3,173 (1,635) (5.861) 797 6,500 (11,416) (64,856) (17,416) (10,419) 8,871 (57.158) (1,902) 2.196 (1.743) (33,436) 9.224 1,047 104,060 (29,159) 367,288 (20,395) (6,205) 274.285 156,750 (6,205) 512.210 Operating activities: Net income. Adjustments to reconcile net income to net cash provided by operating activities: Depreciation and amortization of property and other deferred cost Deferred income taxes Loss (gain) on disposal of assets Proceeds from insurance Gain from insurance proceeds Loss on early extinguishment of debt Asset impairment and store closing charges Changes in operating assets and liabilities (Increase) decrease in accounts receivable Increase in merchandise inventories (Increase) decrease in other current assets. (Increase) decrease in other assets. Increase (decrease) in trade accounts payable and accrued expenses and other liabilities.. Decrease in income taxes payable. Net cash provided by operating activities Investing activities: Purchase of property and equipment. Proceeds from disposal of assets. Proceeds from insurance Investment in joint venture Distribution from joint venture Net cash used in investing activities Financing activities: Principal payments on long-term debt and capital lease obligations. Cash dividends paid. Purchase of treasury stock Issuance cost of line of credit. Net cash used in financing activities (Decrease) increase in cash and cash equivalents Cash and cash equivalents, beginning of year Cash and cash equivalents, end of year Non-cash transactions.... Accrued capital expenditures. Stock awards Accrued purchases of treasury stock See Note 1 Description of Business and Summary of Significant Accounting Policies (137,064) 2,003 3,477 (130,464) 11,683 5.114 (104,824) 1,150 6,322 (20,000) 2,500 (114,852) 3,835 (127,749) 3.460 (110,207) (162,066) (11,108) (129,884) (3.284) (9,787) (240.171) (90,483) (9.424) (223,013) (1.115) (324,035) (159.957) 346,985 187,028 S (303,058) (63,519) 187,028 123,509 s (253,242) 144,116 202.869 346,985 2.597 2,688 23,084 S 2,680 2,000 3,453 2,671 6,002 Consolidated Balance Sheets Dollars in Thousands February 1, 2020 February 2, 2019 277,077 $ 46,160 1,465,007 59,838 1,848,082 123,509 49,853 1,528,417 68,753 1,770,532 Assets Current assets: Cash and cash equivalents Accounts receivable Merchandise inventories Other current assets Total current assets Property and equipment: Land and land improvements Buildings and leasehold improvements Furniture, fixtures and equipment Buildings under construction Buildings and equipment under finance leases Less accumulated depreciation and amortization. 54,067 3,092,405 615,491 18,385 14,556 (2,336,728) 1,458,176 47,924 76,075 3,430,257 S 64,003 3,125,629 603,698 6,707 14,556 (2,227,860) 1,586,733 74,104 3,431,369 921,205 1,214 Operating lease assets. Other assets Total assets Liabilities and stockholders' equity Current liabilities: Trade accounts payable and accrued expenses.... Current portion of finance lease liabilities Current portion of operating lease liabilities Federal and state income taxes. Total current liabilities Long-term debt. Finance lease liabilities Operating lease liabilities Other liabilities. Deferred income taxes Subordinated debentures. Commitments and contingencies Stockholders' equity Common stock, Class A, 119,946,571 and 119,899,553 shares issued: 20,186,368 and 22,338,129 shares outstanding Common stock, Class B (convertible)4,010,401 and 4,010,401 shares issued and outstanding Additional paid-in capital Accumulated other comprehensive loss Retained earings Less treasury stock, at cost. Class A99,760,203 and 97,561,424 shares Total stockholders' equity Total liabilities and stockholders' equity. 892,789 $ 1,219 14,654 22,158 930,820 365,709 695 32,683 273,601 3,490 200,000 11,116 933,535 365,569 1,666 238,731 13,487 200,000 1,199 1,199 40 951,726 (31.059) 4,556,494 (3,855,141) 1,623,259 3,430,257 S 40 948,835 (12.809) 4,458,006 (3,716,890) 1,678,381 3,431,369 Consolidated Statements of Income Dollars in Thousands, Except Per Share Data Net sales Service charges and other income February 1, 2020 6,203,520 139,691 6,343,211 4,235,978 1,691,017 222,349 26,375 46,227 7,667 (20,293) Years Euded February 2, 2019 February 3, 2018 6,356,109 $ 6,261,477 147,240 161,199 6,503,349 6,422,676 4,291,520 4,199,718 1,691,180 1,684,916 223,815 231,595 28,646 28,012 52,518 62,580 7,660 8,026 48 (4,860) Cost of sales Selling, general and administrative expenses Depreciation and amortization Rentals Interest and debt expense, net Other expense (Gain) loss on disposal of assets. Income before income taxes and income on and equity in earnings of joint ventures. Income taxes (benefit). Income on and equity in earnings of joint ventures Net income Eamings per common share: Basic Diluted 133,891 22,810 207,962 37,730 31 170,263 $ 212,689 (7,800) 835 221,324 111,081 S s 4.38 $ 4.38 6.23 $ 6.23 7.51 7.51 Consolidated Statements of Comprehensive Income Dollars in Thousands Years Emded February 1, 2020 February 2, 2019 February 3, 2018 111,081 $ 170,263 $ 221,324 Net income Other comprehensive (loss) income: Amortization of retirement plan and other retiree benefit adjustments (net of tax of ($5,887), $1,646, and (S1,395)) Comprehensive income. (18,250) 92,831 $ 5,177 175,440 $ (4,307) 217,017 $ Consolidated Statements of Stockholders' Equity Dollars in Thousands, Except Share and Per Share Data Accumulated Other Common Stock Additional Comprehensive Paid-in Retained Class A Treasury Class B Capital Loss Earnings Stock Total Balance, January 28, 2017. $ 1,198 $ 40 $ 943,467 $ (11,137) $ 4,153,844 $(3,369,995) $ 1,717,417 Net income 221,324 221,324 Other comprehensive loss (4,307) (4,307) Issuance of 46,042 shares under stock plans 2,680 2,681 Purchase of 4,096,972 shares of treasury stock (219,011) (219,011) Cash dividends declared: Common stock, 50.34 (9,949) (9.949) per share 1,199 40 946,147 (15,444) (3,589,006) 4,365,219 170,263 1,708,155 170,263 (2,542) (66,574) (69,116) - 5,177 5,177 Balance, February 3, 2018 Net income Cumulative effect adjustment related to ASU 2016-16 and 2018-02 Other comprehensive income. Issuance of 38,809 shares under stock plans Purchase of 1,796,908 shares of treasury stock Cash dividends declared: Common stock, S0.40 per share. - 2,688 2,688 - - (127,884) (127,884) (10,902) (10,902) 1,199 40 948,835 (12,809) (3,716,890) 4,458,006 111,081 1,678,381 111,081 (18,250) (18,250) Balance, February 2, 2019 Net income. Other comprehensive loss Issuance of 47,018 shares under stock plans Purchase of 2,198,779 shares of treasury stock Cash dividends declared: Common stock, $0.50 2,891 2,891 (138,251) (138,251) per share. (12,593) (12,593) so Balance, February 1, 2020. $ 1,199 $ 40 $ 951,726 $ (31,059) $ 4,556,494 $ (3,855,141) $1,623,259 Consolidated Statements of Cash Flows Dollars in Thousands February 1, 2020 Years Emded February 2, 2019 February 3, 2018 s 111,081 $ 170,263 $ 221,324 225,849 334 224,309 (5,415) (20,293) 397 233,683 (102,065) 1,000 48 (5,861) 797 3,693 63,410 9,554 (1,220) (11,416) (64,856) (17,416) (10,419) 8,871 (57.158) (1.902) 2.196 (25,597) 5,155 365,074 104,060 (29,159) 367,288 (20,395) (6,205) 274,285 Operating activities: Net income Adjustments to reconcile net income to net cash provided by operating activities: Depreciation and amortization of property and other deferred cost Deferred income taxes.. (Gain) loss on disposal of assets Proceeds from insurance Gain from insurance proceeds Loss on early extinguishment of debt Changes in operating assets and liabilities: Decrease increase) in accounts receivable Decrease increase) in merchandise inventories Decrease increase) in other current assets (Increase) decrease in other assets. (Decrease) increase in trade accounts payable and accrued expenses and other liabilities Increase (decrease) in income taxes payable Net cash provided by operating activities Investing activities: Purchase of property and equipment and capitalized software, Proceeds from disposal of assets Proceeds from insurance Distribution from joint venture Net cash used in investing activities Financing activities: Principal payments on long-term debt and finance lease liabilities.. Cash dividends paid. Purchase of treasury stock Issuance cost of line of credit. Net cash used in financing activities Increase (decrease) in cash and cash equivalents. Cash and cash equivalents, beginning of year Cash and cash equivalents, end of year Non-cash transactions Accrued capital expenditures. Stock awards. Accrued purchases of treasury stock Lease assets obtained in exchange for new operating lease liabilities (103,383) 30,580 2,416 2.295 (68,092) (137,064) 2,003 3,477 (130,464) 11,683 5,114 3,460 (110,207) 3,835 (127,749) (966) (11,520) (130,928) (162,066) (11,108) (129,884) (90,483) (9,424) (223,013) (1.115) (324,035) (159,957) 346,985 187,028 (143,414) 153,568 123,509 277,077 S (303,058) (63,519) 187,028 123,509 s S 9,295 $ 2,891 7,323 2.597 S 2.688 23,084 2.680 2.000 7.974