

Question
Please help me with these. Thank you. 1.Statistical technique used to determine the strength or degree of linear relationship existing between continuous interval level and
Please help me with these. Thank you.
1.Statistical technique used to determine the strength or degree of linear relationship existing between continuous interval level and the other is dichotomous variable. *
Spearman Rank Order Correlation (rho)
Regression Analysis
Pearson Product Moment Correlation
Point-Biserial Correlation
2.Statistical technique used to determine the strength or degree of linear relationship existing between two quantitative continuous variables at an interval and ratio level. *
Pearson Product Moment Correlation
Regression Analysis
Point-Biserial Correlation
Spearman Rank Order Correlation (rho)
3.Statistical technique used to predict the value of a dependent variable based on the value of at least one independent variable. *
Spearman Rank Order Correlation (rho)
Pearson Product Moment Correlation
Point-Biserial Correlation
Regression Analysis
4.Statistical technique used to determine the strength or degree of linear relationship existing between two qualitative variables in ordinal level. *
Point-Biserial Correlation
Regression Analysis
Pearson Product Moment Correlation
Spearman Rank Order Correlation (rho)
5.Which correlation coefficient represents the strongest linear relationship between two variables? *
0.00
0.50
0.64
-0.89
6.The value of correlation coefficient (r) ranges from 0 to 1. *
True
False
7.The value of correlation coefficient (r) does not change if all values of either variable are converted to a different scale. *
True
False
8.The value of correlation coefficient (r) is affected by the choice of x or y. *
True
False
9.The value of correlation coefficient (r) is sensitive to outliers. *
True
False
10.Zero linear correlation implies that the independent variable is not related with the independent variable. *
True
False
11.In regression equation, b1 is the estimated average value of y when the value of x is zero. *
True
False
12.In regression equation, b0 is the estimated change in the average value of y as a result of a one-unit change in x. *
True
False
13.R^2 is the proportion of the total variation in the independent variable that is explained by the variation in the dependent variable. *
True
False
14.R^2 is the squared of the correlation coefficient. *
True
False
15.A coefficient of determination of 100% is associated with a correlation coefficient of +1.0. *
True
False
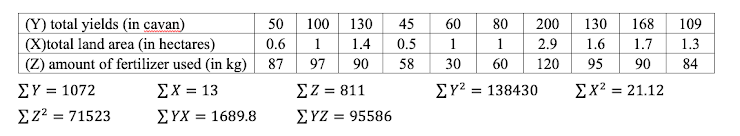
The following data were collected to determine a suitable regression equation relating to the yields of the farmers.
Step by Step Solution
There are 3 Steps involved in it
Step: 1

Get Instant Access to Expert-Tailored Solutions
See step-by-step solutions with expert insights and AI powered tools for academic success
Step: 2

Step: 3
Ace Your Homework with AI
Get the answers you need in no time with our AI-driven, step-by-step assistance
Get Started
Calculus Early Transcendentals
Authors: Michael Sullivan, Kathleen Miranda
2nd Edition
1319067484, 9781319067489