

Answered step by step
Verified Expert Solution
Question
1 Approved Answer
Please help me with these two questions. The following Minitab output is from a regression of temperature (in C} on atmospheric concentration of carbon dioxide
Please help me with these two questions.
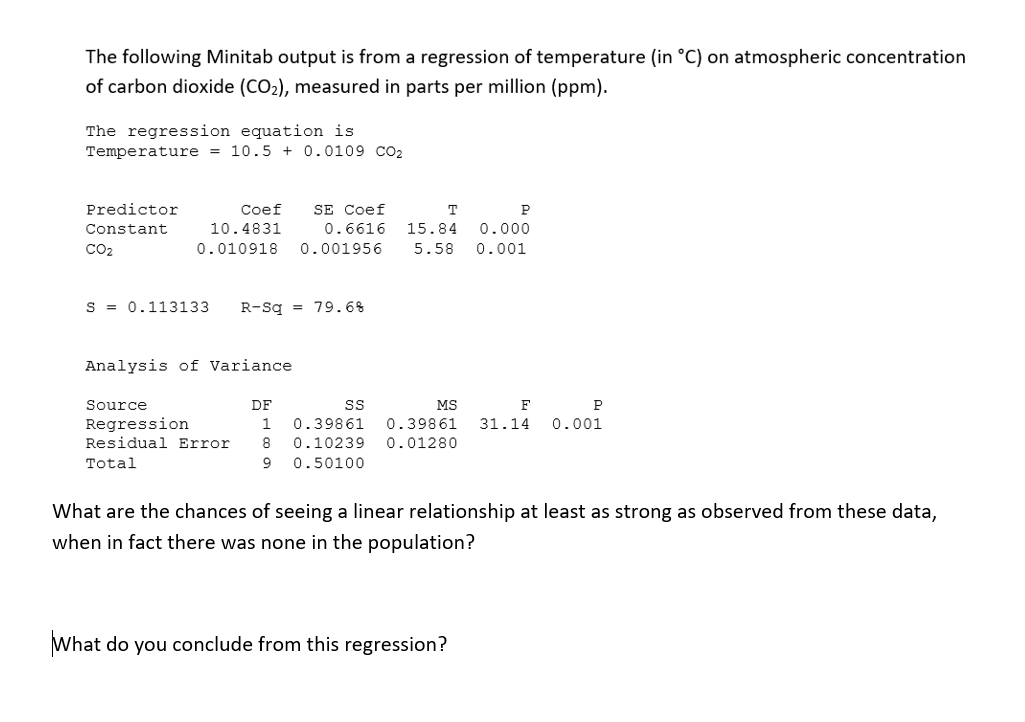 The following Minitab output is from a regression of temperature (in C} on atmospheric concentration of carbon dioxide (C02), measured in parts per million (ppm). The regression equation is Temperature = 10.5 + 0.0109 002 Predictor Coef SE Coef T P Constant 10.4831 0.6516 15.84 0.000 CO; 0.010918 0-001956 5.53 0.001 S = 0.113133 R-Sq = 79.6% Analysis of Variance Source DF SS MS E' P Regression 1 0.39861 0.39861 31.14 0.001 Residual Error 3 0.10239 0.01280 Total 9 0.50100 What are the chances of seeing a linear relationship at least as strong as observed from these data, when in fact there was none in the population? lWhat do you conclude from this regression
 Step by Step Solution
There are 3 Steps involved in it
Step: 1

Get Instant Access to Expert-Tailored Solutions
See step-by-step solutions with expert insights and AI powered tools for academic success
Step: 2

Step: 3
Ace Your Homework with AI
Get the answers you need in no time with our AI-driven, step-by-step assistance
Get Started
Wavelet Based Approximation Schemes For Singular Integral Equations
Authors: Madan Mohan Panja, Birendra Nath Mandal
1st Edition
0429534280, 9780429534287