Answered step by step
Verified Expert Solution
Question
1 Approved Answer
please help me with this as soon as possible .. Use the MS Excel file named people to answer the questions You may create your
please help me with this as soon as possible .. 

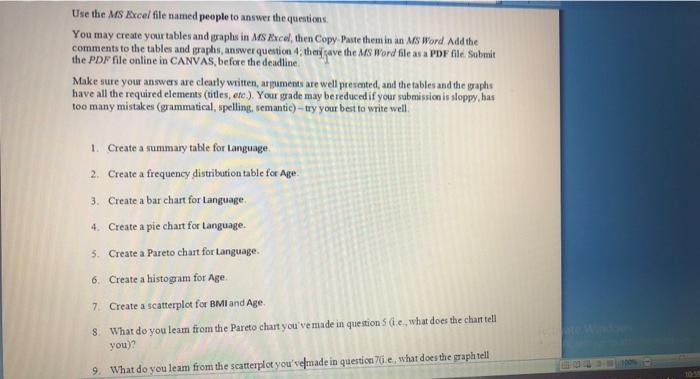
Use the MS Excel file named people to answer the questions You may create your tables and graphs in MS Axcel, then Copy Paste them in an MS Word Add the comments to the tables and graphs, answer question 4: the gave the MS Word file as a PDF file. Submit the PDF file online in CANVAS, before the deadline Make sure your answers are clearly written, arguments are well presented, and the tables and the graphs have all the required elements (titles, etc.). Your grade may be reduced if your submission is sloppy, has too many mistakes (grammatical, spelling, semantic) - try your best to write well a 1. Create a summary table for Language 2. Create a frequency distribution table for Age 3. Create a bar chart for Language 4. Create a pie chart for Language. 5. Create a Pareto chart for Language 6. Create a histogram for Age 7. Create a scatterplot for BMI and Age 8. What do you leam from the Pareto chart you've made in questions (ie, what does the chart tell a you) 9. What do you leam from the scatterplot you've made in questione, what does the graph tell w many mistakes (grammatical, spelling, semantic) -- try your best to write well yetecedit your submission is sloppy, has TY 1. Create a summary table for language 2. Create a frequency distribution table for Age 3. Create a bar chart for language 4. Create a pie chart for Language 5. Create a Pareto chart for Language 6. Create a histogram for Age 7. Create a scatterplot for BMI and Age 8. What do you learn from the Pareto chart you've made in questions de what does the chait tell you) 9. What do you leam from the scatterplot you've made in question i e, what does the graph tell a you)? 10. How do the pie chart question 4) and the Pareto chart (question tell you the same information about the languages that people in your sample speak Use the MS Excel file named people to answer the questions You may create your tables and graphs in MS Axcel, then Copy Paste them in an MS Word Add the comments to the tables and graphs, answer question 4: the gave the MS Word file as a PDF file. Submit the PDF file online in CANVAS, before the deadline Make sure your answers are clearly written, arguments are well presented, and the tables and the graphs have all the required elements (titles, etc.). Your grade may be reduced if your submission is sloppy, has too many mistakes (grammatical, spelling, semantic) - try your best to write well a 1. Create a summary table for Language 2. Create a frequency distribution table for Age 3. Create a bar chart for Language 4. Create a pie chart for Language. 5. Create a Pareto chart for Language 6. Create a histogram for Age 7. Create a scatterplot for BMI and Age 8. What do you leam from the Pareto chart you've made in questions (ie, what does the chart tell a you) 9. What do you leam from the scatterplot you've made in questione, what does the graph tell w many mistakes (grammatical, spelling, semantic) -- try your best to write well yetecedit your submission is sloppy, has TY 1. Create a summary table for language 2. Create a frequency distribution table for Age 3. Create a bar chart for language 4. Create a pie chart for Language 5. Create a Pareto chart for Language 6. Create a histogram for Age 7. Create a scatterplot for BMI and Age 8. What do you learn from the Pareto chart you've made in questions de what does the chait tell you) 9. What do you leam from the scatterplot you've made in question i e, what does the graph tell a you)? 10. How do the pie chart question 4) and the Pareto chart (question tell you the same information about the languages that people in your sample speak 

Step by Step Solution
There are 3 Steps involved in it
Step: 1

Get Instant Access to Expert-Tailored Solutions
See step-by-step solutions with expert insights and AI powered tools for academic success
Step: 2

Step: 3

Ace Your Homework with AI
Get the answers you need in no time with our AI-driven, step-by-step assistance
Get Started


