Please help me with this excel question, if you could please specificy the excel workings that would be fantastic, thank yo
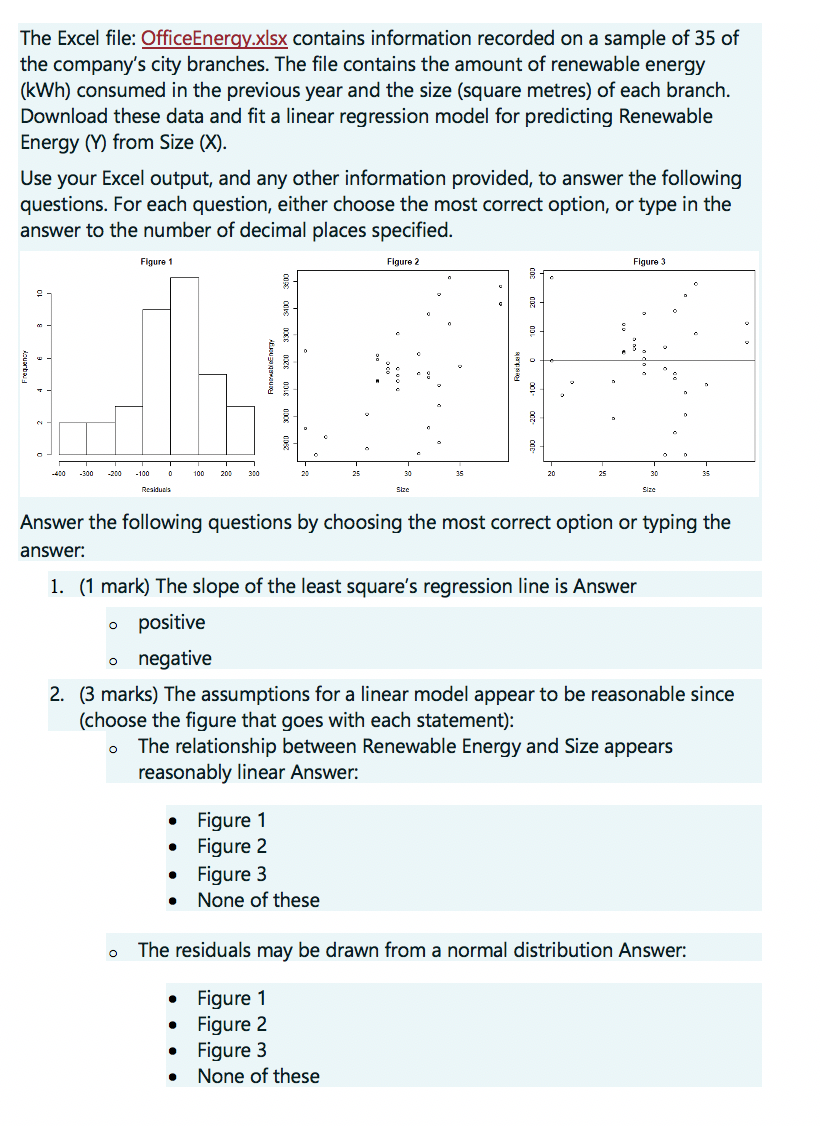
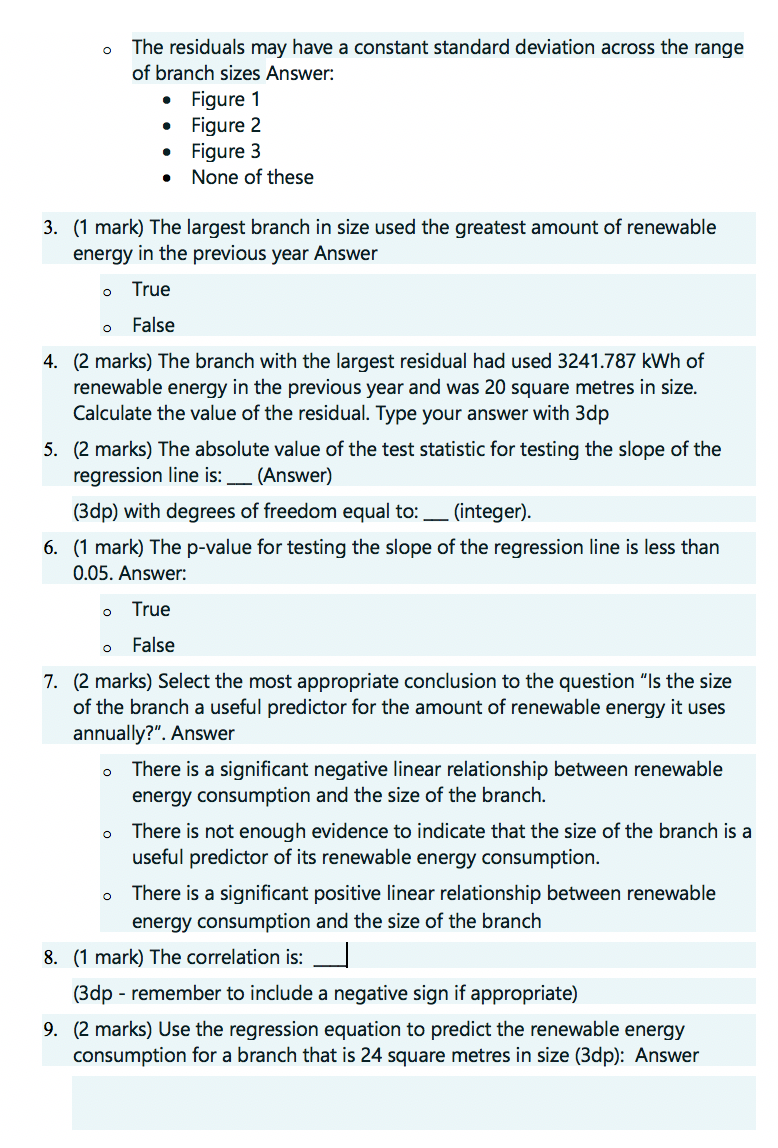
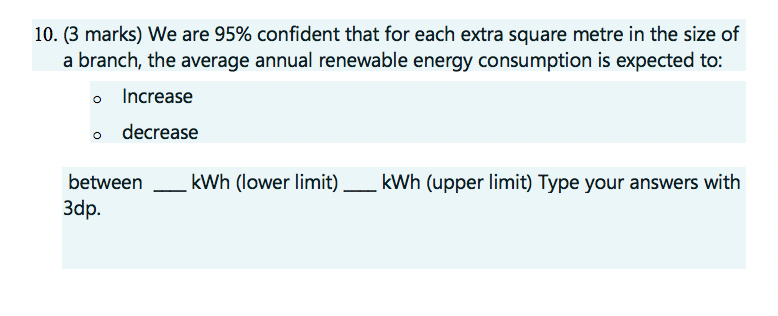
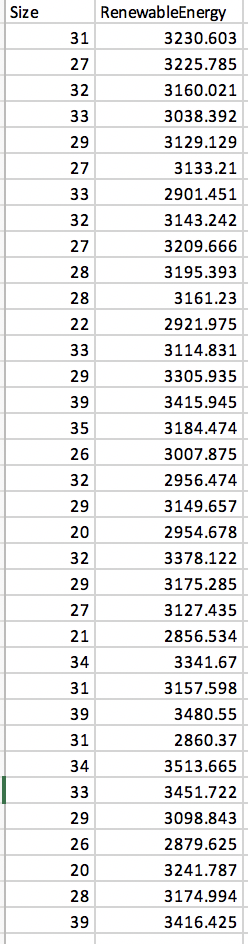
The Excel file: OfficeEnergy.xIsx contains information recorded on a sample of 35 of the company's city branches. The file contains the amount of renewable energy (kWh) consumed in the previous year and the size (square metres) of each branch. Download these data and fit a linear regression model for predicting Renewable Energy (Y) from Size (X). Use your Excel output, and any other information provided, to answer the following questions. For each question, either choose the most correct option, or type in the answer to the number of decimal places specified. Figure 1 Figure 2 Figure 3 100 2300 3000 3100 3200 9300 3100 3500 Frequency .300 450 -300 -200 -100 100 200 320 35 20 25 30 Residuals Size Answer the following questions by choosing the most correct option or typing the answer: 1. (1 mark) The slope of the least square's regression line is Answer o positive o negative 2. (3 marks) The assumptions for a linear model appear to be reasonable since (choose the figure that goes with each statement): The relationship between Renewable Energy and Size appears reasonably linear Answer: . Figure 1 Figure 2 . . Figure 3 . None of these o The residuals may be drawn from a normal distribution Answer: . Figure 1 Figure 2 . . Figure 3 None of theseo The residuals may have a constant standard deviation across the range of branch sizes Answer: I Figure 1 a Figure 2 a Figure 3 I None of these . (1 mark) The largest branch in size used the greatest amount of renewable energy in the previous year Answer 0 True 0 False . (2 marks) The branch with the largest residual had used 3241.787 kWh of renewable energy in the previous year and was 20 square metres in size. Calculate the value of the residual. Type your answer with 3dp . (2 marks) The absolute value of the test statistic for testing the slope of the regression line is: _ (Answer) (3dp) with degrees of freedom equal to: _ (integer). . (1 mark) The p-value for testing the slope of the regression line is less than 0.05. Answer: 0 True 0 False . (2 marks) Select the most appropriate conclusion to the question "Is the size of the branch a useful predictor for the amount of renewable energy it uses annually?". Answer 0 There is a signicant negative linear relationship between renewable energy consumption and the size of the branch. 0 There is not enough evidence to indicate that the size of the branch is a useful predictor of its renewable energy consumption. 0 There is a signicant positive linear relationship between renewable energy consumption and the size of the branch . ('1 mark) The correlation is: J (3dp - remember to include a negative sign if appropriate) . (2 marks) Use the regression equation to predict the renewable energy consumption for a branch that is 24 square metres in size (3dp): Answer 10. (3 marks) We are 95% condent that for each extra square metre in the size of a branch, the average annual renewable energy consumption is expected to: 0 Increase 0 decrease between _ kWh {lower limit) _ kWh (upper limit) Type your answers with 3dp. Size RenewableEnergy 31 3230.603 27 3225.785 32 3160.021 33 3038.392 29 3129.129 27 3133.21 33 2901.451 32 3143.242 27 3209.666 28 3195.393 28 3161.23 22 2921.975 33 3114.831 29 3305.935 39 3415.945 35 3184.474 26 3007.875 32 2956.474 29 3149.657 20 2954.678 32 3378.122 29 3175.285 27 3127.435 21 2856.534 34 3341.67 31 3157.598 39 3480.55 31 2860.37 34 3513.665 33 3451.722 29 3098.843 26 2879.625 20 3241.787 28 3174.994 39 3416.425