Answered step by step
Verified Expert Solution
Link Copied!

Question

1 Approved Answer

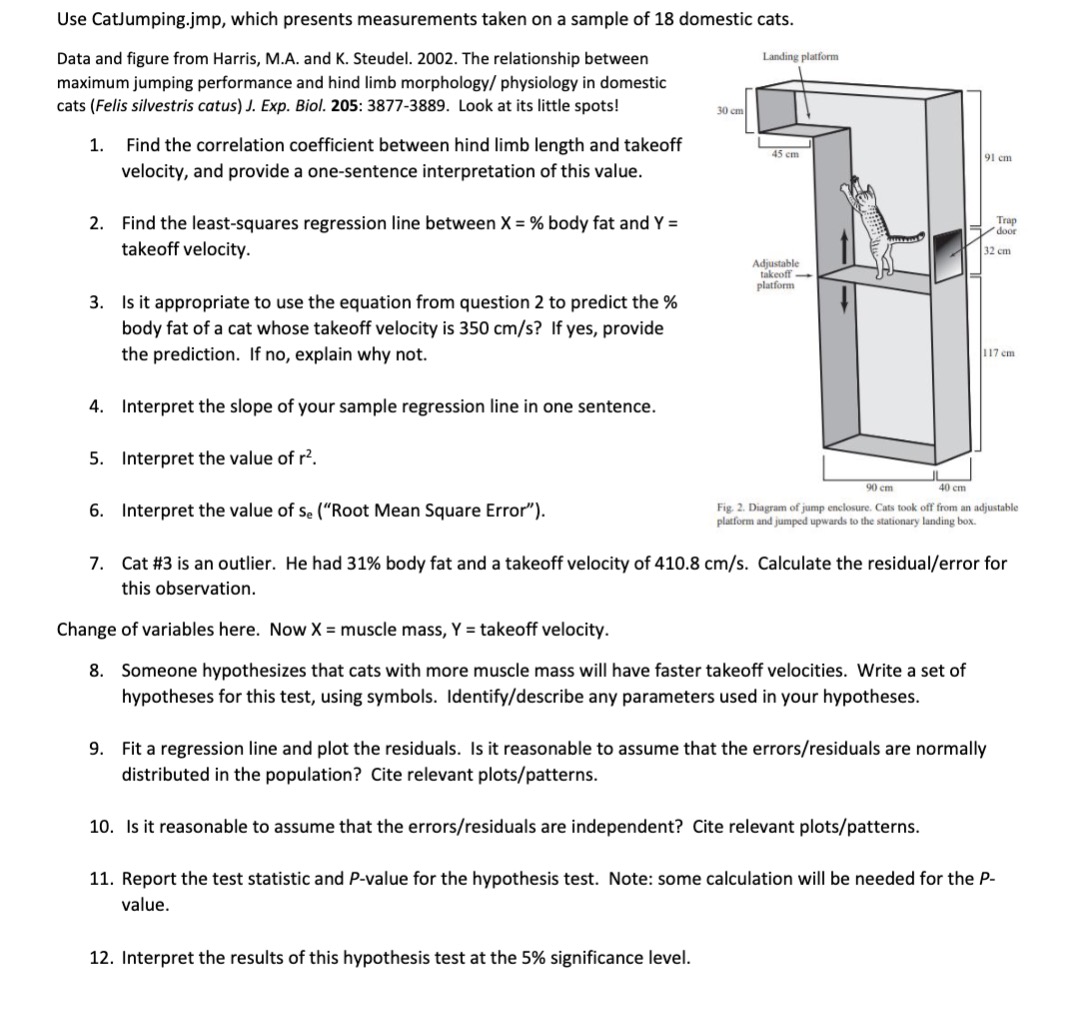
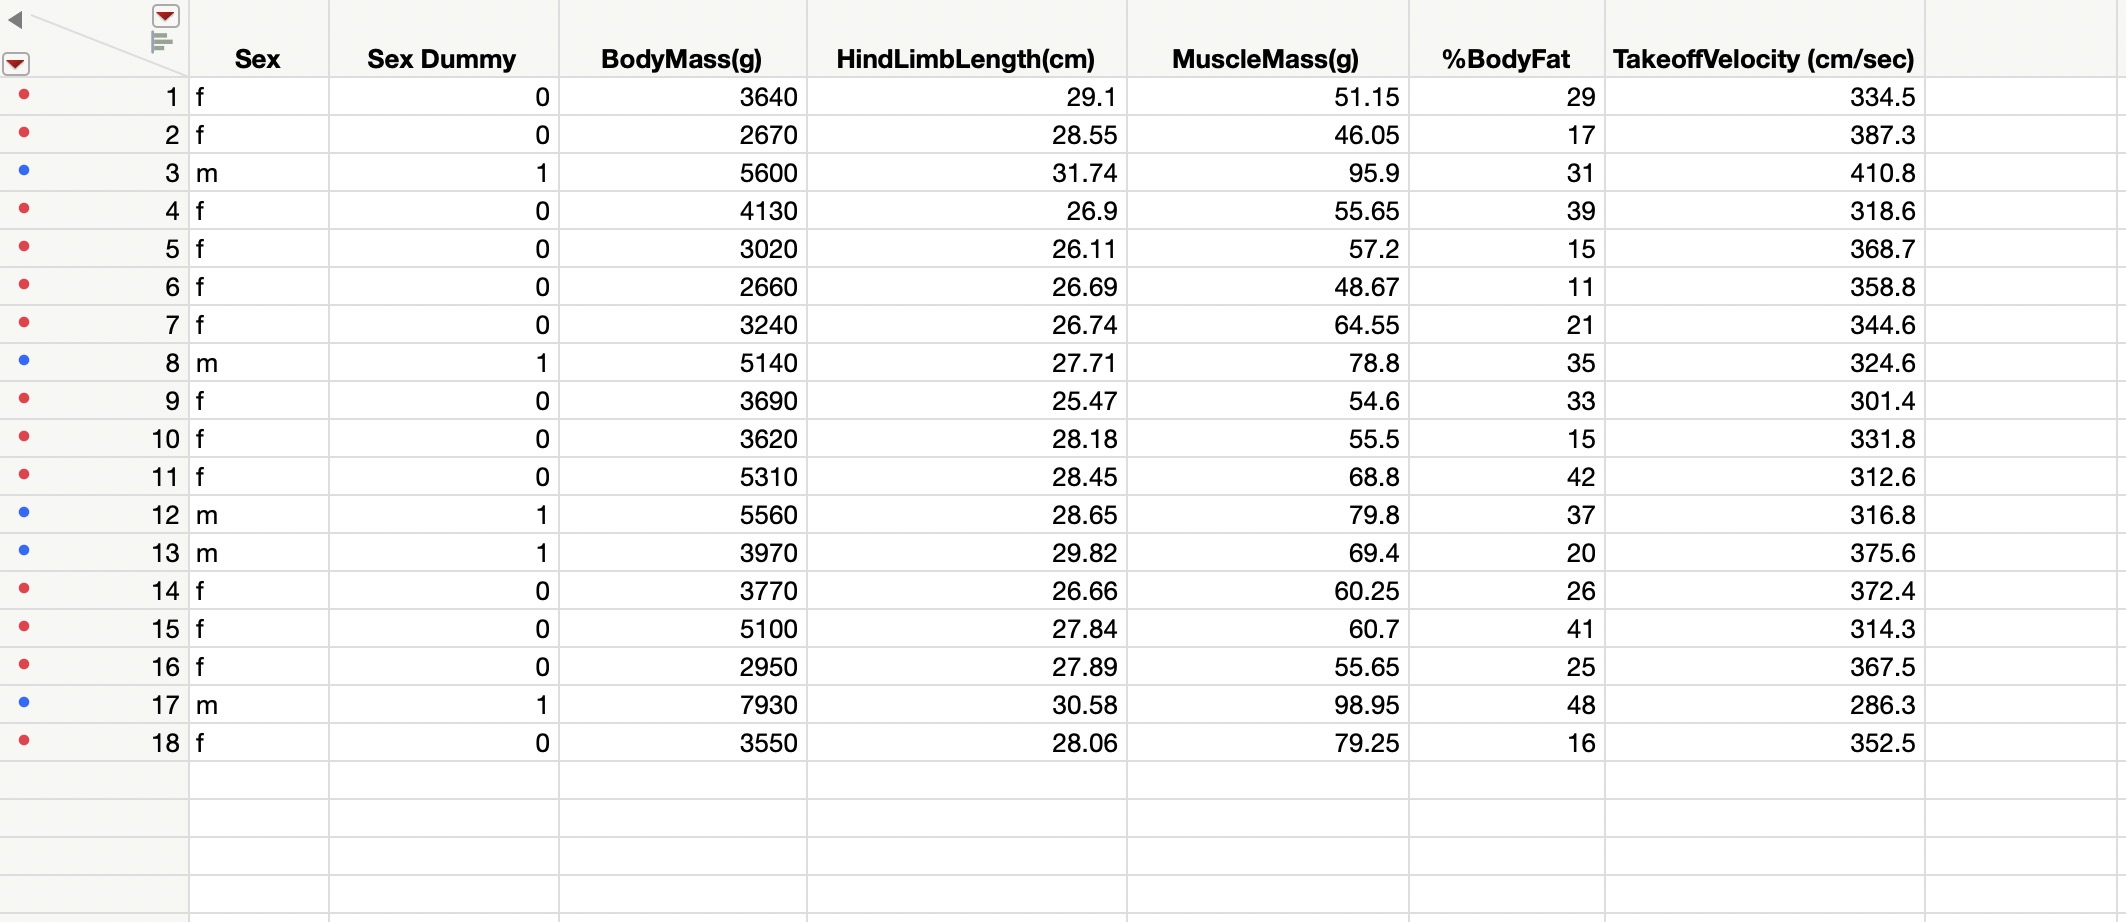
Please help me with this homework worksheet, thank you! I am having a hard time understanding. Use CatJumping.jmp, which presents measurements taken on a sample

image text in transcribed

Please help me with this homework worksheet, thank you! I am having a hard time understanding.

image text in transcribedimage text in transcribed
Use CatJumping.jmp, which presents measurements taken on a sample of 13 domestic cats. Data and gure from Harris, MA. and K. Steudel. 2002. The relationship between maximum Jumping performance and hind limb morphology;f physiology in domestic cats (Fall's silvestris cows} J. Exp. Biol. 105: 3877-3889. Look at its little spots! 1. Find the correlation coefficient between hind limb length and takeoff velocity, and provide a one-sentence interpretation ofthis value. Find the least-squares regression line between X = 96 body fat and Y = takeoff velocity. Is it appropriate to use the equation from question 2 to predict the 96 body fat of a cat whose takeoff velocity is 350 cm/s? If yes, provide the prediction. If no, explain why not. Interpret the slope of your sample regression line in one sentence. Interpret the value of r1. Interpret the value of 5. (\"Root Mean Square Error"). mgmrznmmmmh Cat #3 is an outlier. He had 31% body fat and a takeoff velocity of 410.3 cmfs. Calculate the residual/error for this observation. Change of variables here. Now it = muscle mass, Y = takeoff velocity. 10. 11. 12. Someone hypothesizes that cats with more muscle mass will have faster takeoff velocities. Write a set of hypotheses for this test, using symbols. Identify/describe any parameters used in your hypotheses. Fit a regression line and plot the residuals. Is it reasonable to assume that the errors/residuals are normally distributed in the population? Cite relevant plotsfpatterns. Is it reasonable to assume that the errorslresiduals are independent? Cite relevant plots/patterns. Report the test statistic and Pvalue for the hypothesis test. Note: some calculation will be needed for the P- value. Interpret the results of this hypothesis test at the 5% signicance level.

Step by Step Solution

There are 3 Steps involved in it

Step: 1

blur-text-image

Get Instant Access to Expert-Tailored Solutions

See step-by-step solutions with expert insights and AI powered tools for academic success

Step: 2

blur-text-image

Step: 3

blur-text-image

Ace Your Homework with AI

Get the answers you need in no time with our AI-driven, step-by-step assistance

Get Started

Recommended Textbook for

Discrete Mathematics Mathematical Reasoning And Proof With Puzzles, Patterns, And Games

Authors: Douglas E Ensley, J Winston Crawley

1st Edition

1118226534, 9781118226537

More Books

Students also viewed these Mathematics questions