please help me with this in detail!
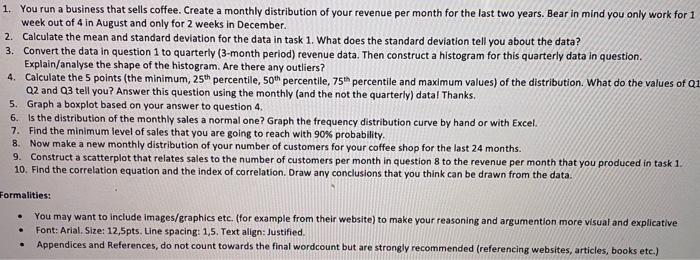
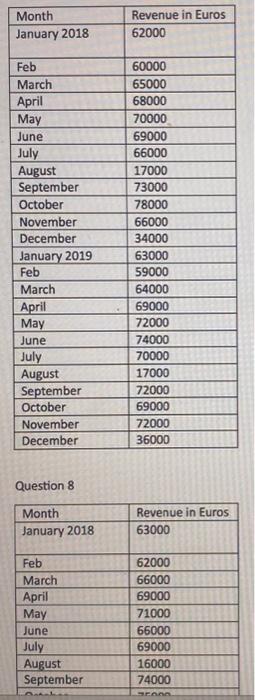
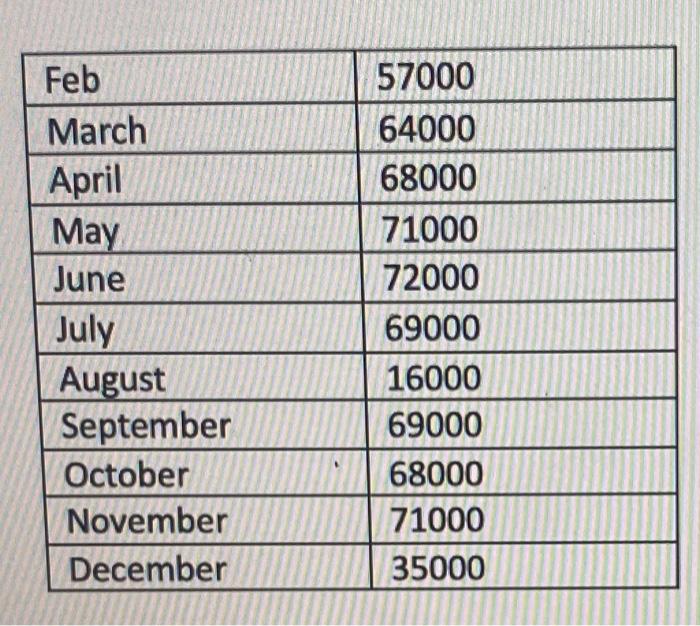
1. You run a business that sells coffee. Create a monthly distribution of your revenue per month for the last two years. Bear in mind you only work for 1 week out of 4 in August and only for 2 weeks in December. 2. Calculate the mean and standard deviation for the data in task 1. What does the standard deviation tell you about the data? 3. Convert the data in question 1 to quarterly (3-month period) revenue data. Then construct a histogram for this quarterly data in question. Explain/analyse the shape of the histogram. Are there any outliers? 4. Calculate the 5 points (the minimum, 25th percentlle, 50th percentile, 75th percentile and maximum values) of the distribution. What do the values of C Q2 and Q3 tell you? Answer this question using the monthly (and the not the quarterly) data! Thanks. 5. Graph a boxplot based on your answer to question 4. 6. Is the distribution of the monthly sales a normal one? Graph the frequency distribution curve by hand or with Excel. 7. Find the minimum level of sales that you are going to reach with 90% probability. 8. Now make a new monthly distribution of your number of customers for your coffee shop for the last 24 months. 9. Construct a scatterplot that relates sales to the number of customers per month in question 8 to the revenue per month that you produced in task 1 . 10. Find the correlation equation and the index of correlation. Draw any conclusions that you think can be drawn from the data. - You may want to include images/graphics etc. (for example from their website) to make your reasoning and argumention more visual and explicative - Font: Arial. Size: 12,5pts. Line spacing: 1,5. Text align: Justified. - Appendices and References, do not count towards the final wordcount but are strongly recommended (referencing websites, articles, books etc.) Question 8 \begin{tabular}{|l|l|} \hline Feb & 57000 \\ \hline March & 64000 \\ \hline April & 68000 \\ \hline May & 71000 \\ \hline June & 72000 \\ \hline July & 69000 \\ \hline August & 16000 \\ \hline September & 69000 \\ \hline October & 68000 \\ \hline November & 71000 \\ \hline December & 35000 \\ \hline \end{tabular} 1. You run a business that sells coffee. Create a monthly distribution of your revenue per month for the last two years. Bear in mind you only work for 1 week out of 4 in August and only for 2 weeks in December. 2. Calculate the mean and standard deviation for the data in task 1. What does the standard deviation tell you about the data? 3. Convert the data in question 1 to quarterly (3-month period) revenue data. Then construct a histogram for this quarterly data in question. Explain/analyse the shape of the histogram. Are there any outliers? 4. Calculate the 5 points (the minimum, 25th percentlle, 50th percentile, 75th percentile and maximum values) of the distribution. What do the values of C Q2 and Q3 tell you? Answer this question using the monthly (and the not the quarterly) data! Thanks. 5. Graph a boxplot based on your answer to question 4. 6. Is the distribution of the monthly sales a normal one? Graph the frequency distribution curve by hand or with Excel. 7. Find the minimum level of sales that you are going to reach with 90% probability. 8. Now make a new monthly distribution of your number of customers for your coffee shop for the last 24 months. 9. Construct a scatterplot that relates sales to the number of customers per month in question 8 to the revenue per month that you produced in task 1 . 10. Find the correlation equation and the index of correlation. Draw any conclusions that you think can be drawn from the data. - You may want to include images/graphics etc. (for example from their website) to make your reasoning and argumention more visual and explicative - Font: Arial. Size: 12,5pts. Line spacing: 1,5. Text align: Justified. - Appendices and References, do not count towards the final wordcount but are strongly recommended (referencing websites, articles, books etc.) Question 8 \begin{tabular}{|l|l|} \hline Feb & 57000 \\ \hline March & 64000 \\ \hline April & 68000 \\ \hline May & 71000 \\ \hline June & 72000 \\ \hline July & 69000 \\ \hline August & 16000 \\ \hline September & 69000 \\ \hline October & 68000 \\ \hline November & 71000 \\ \hline December & 35000 \\ \hline \end{tabular}