Answered step by step
Verified Expert Solution
Link Copied!

Question

1 Approved Answer

Please help me with this problem I been stuck in this problem for 45 min and don't know how to go about it ????I done

Please help me with this problem I been stuck in this problem for 45 min and don't know how to go about it ????I done all my problems and this last one asks me to make the histograms and for some reason I don't get how to do it
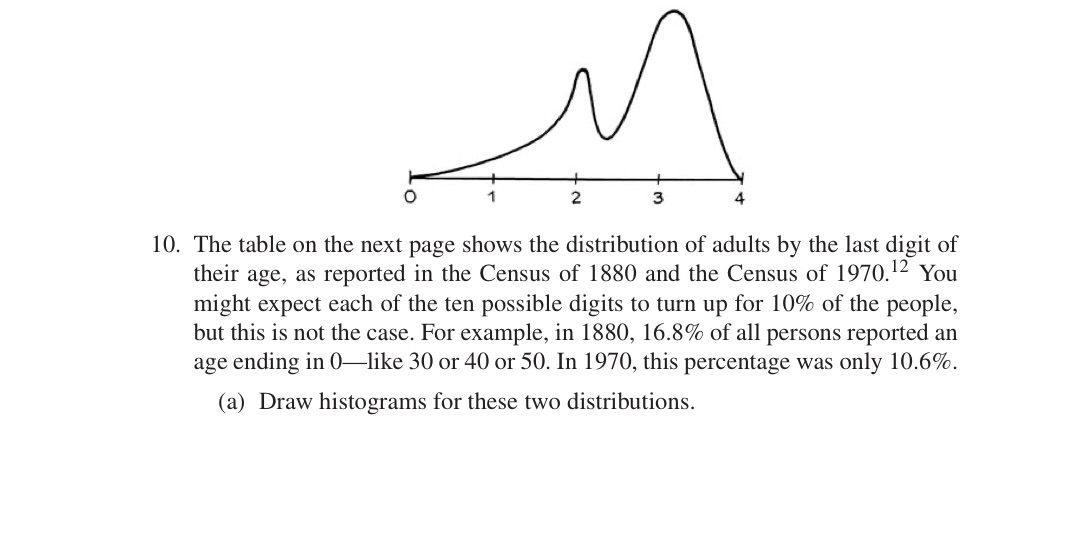
image text in transcribed
0 '1 2 3 4 10. The table on the next page shows the distribution of adults by the last digit of their age, as reported in the Census of 1880 and the Census of 19170.12 You might expect each of the ten possible digits to turn up for 10% of the people, but this is not the case. For example, in 1880, 16.8% of all persons reported an age ending in 0like 30 or 40 or 50. In 1970, this percentage was only 10.6%. (a) Draw histograms for these two distributions

Step by Step Solution

There are 3 Steps involved in it

Step: 1

blur-text-image

Get Instant Access to Expert-Tailored Solutions

See step-by-step solutions with expert insights and AI powered tools for academic success

Step: 2

blur-text-image

Step: 3

blur-text-image

Ace Your Homework with AI

Get the answers you need in no time with our AI-driven, step-by-step assistance

Get Started

Recommended Textbook for

Finite Mathematics

Authors: Stefan Waner, Jerry Lee Ford Jr, Waner/Costenoble, Steven Costenoble

5th Edition

1111789304, 9781111789305

More Books

Students also viewed these Mathematics questions