

Answered step by step
Verified Expert Solution
Question
1 Approved Answer
Please help me with this python problem. Go to the website https://www.ncdc.noaa.gov/cdo-web/search and make a request to download weather data for some place that interests
Please help me with this python problem.
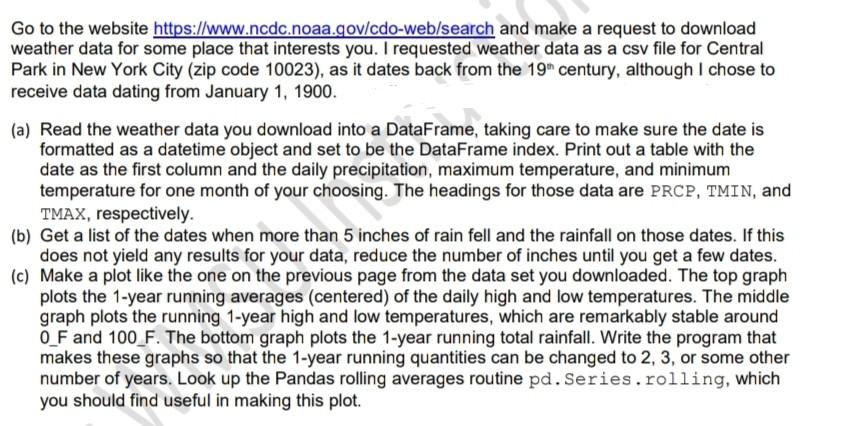
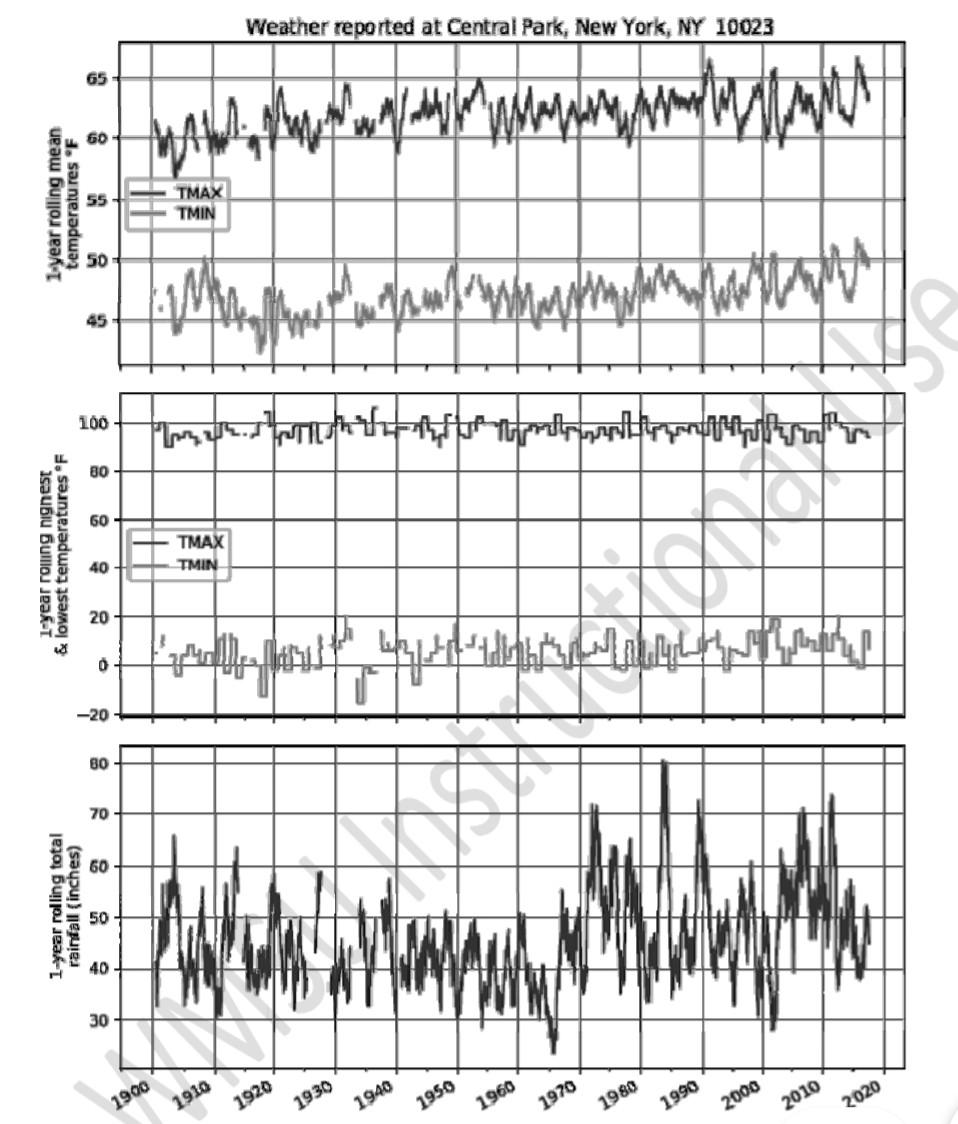
Go to the website https://www.ncdc.noaa.gov/cdo-web/search and make a request to download weather data for some place that interests you. I requested weather data as a csv file for Central Park in New York City (zip code 10023), as it dates back from the 19" century, although I chose to receive data dating from January 1, 1900. (a) Read the weather data you download into a DataFrame, taking care to make sure the date is formatted as a datetime object and set to be the DataFrame index. Print out a table with the date as the first column and the daily precipitation, maximum temperature, and minimum temperature for one month of your choosing. The headings for those data are PRCP, TMIN, and TMAX, respectively. (b) Get a list of the dates when more than 5 inches of rain fell and the rainfall on those dates. If this does not yield any results for your data, reduce the number of inches until you get a few dates. (c) Make a plot like the one on the previous page from the data set you downloaded. The top graph plots the 1-year running averages (centered) of the daily high and low temperatures. The middle graph plots the running 1-year high and low temperatures, which are remarkably stable around O_F and 100_F. The bottom graph plots the 1-year running total rainfall. Write the program that makes these graphs so that the 1-year running quantities can be changed to 2, 3, or some other number of years. Look up the Pandas rolling averages routine pd. Series.rolling, which you should find useful in making this plot. Weather reported at Central Park, New York, NY 10023 65 way by way with 60 1-year rolling mean emperatures "F 55 TMAX TMIN 50 wwwww 45 I 100 Home Theory 80 60 nignest & lowest temperat 1-year temperatures F H TMAX TMIN 40+ 20 SILD 0 wadu platus per -20 80 70 60 50 Mobilarna 40 30 1900 1910 1950 1960 1970 1920 1930 1940 1980 1990 2000 2010 2020 Go to the website https://www.ncdc.noaa.gov/cdo-web/search and make a request to download weather data for some place that interests you. I requested weather data as a csv file for Central Park in New York City (zip code 10023), as it dates back from the 19" century, although I chose to receive data dating from January 1, 1900. (a) Read the weather data you download into a DataFrame, taking care to make sure the date is formatted as a datetime object and set to be the DataFrame index. Print out a table with the date as the first column and the daily precipitation, maximum temperature, and minimum temperature for one month of your choosing. The headings for those data are PRCP, TMIN, and TMAX, respectively. (b) Get a list of the dates when more than 5 inches of rain fell and the rainfall on those dates. If this does not yield any results for your data, reduce the number of inches until you get a few dates. (c) Make a plot like the one on the previous page from the data set you downloaded. The top graph plots the 1-year running averages (centered) of the daily high and low temperatures. The middle graph plots the running 1-year high and low temperatures, which are remarkably stable around O_F and 100_F. The bottom graph plots the 1-year running total rainfall. Write the program that makes these graphs so that the 1-year running quantities can be changed to 2, 3, or some other number of years. Look up the Pandas rolling averages routine pd. Series.rolling, which you should find useful in making this plot. Weather reported at Central Park, New York, NY 10023 65 way by way with 60 1-year rolling mean emperatures "F 55 TMAX TMIN 50 wwwww 45 I 100 Home Theory 80 60 nignest & lowest temperat 1-year temperatures F H TMAX TMIN 40+ 20 SILD 0 wadu platus per -20 80 70 60 50 Mobilarna 40 30 1900 1910 1950 1960 1970 1920 1930 1940 1980 1990 2000 2010 2020Step by Step Solution
There are 3 Steps involved in it
Step: 1

Get Instant Access to Expert-Tailored Solutions
See step-by-step solutions with expert insights and AI powered tools for academic success
Step: 2

Step: 3
Ace Your Homework with AI
Get the answers you need in no time with our AI-driven, step-by-step assistance
Get Started
Database Concepts
Authors: David Kroenke, David J. Auer
3rd Edition
0131986252, 978-0131986251