Please help me with this thank you
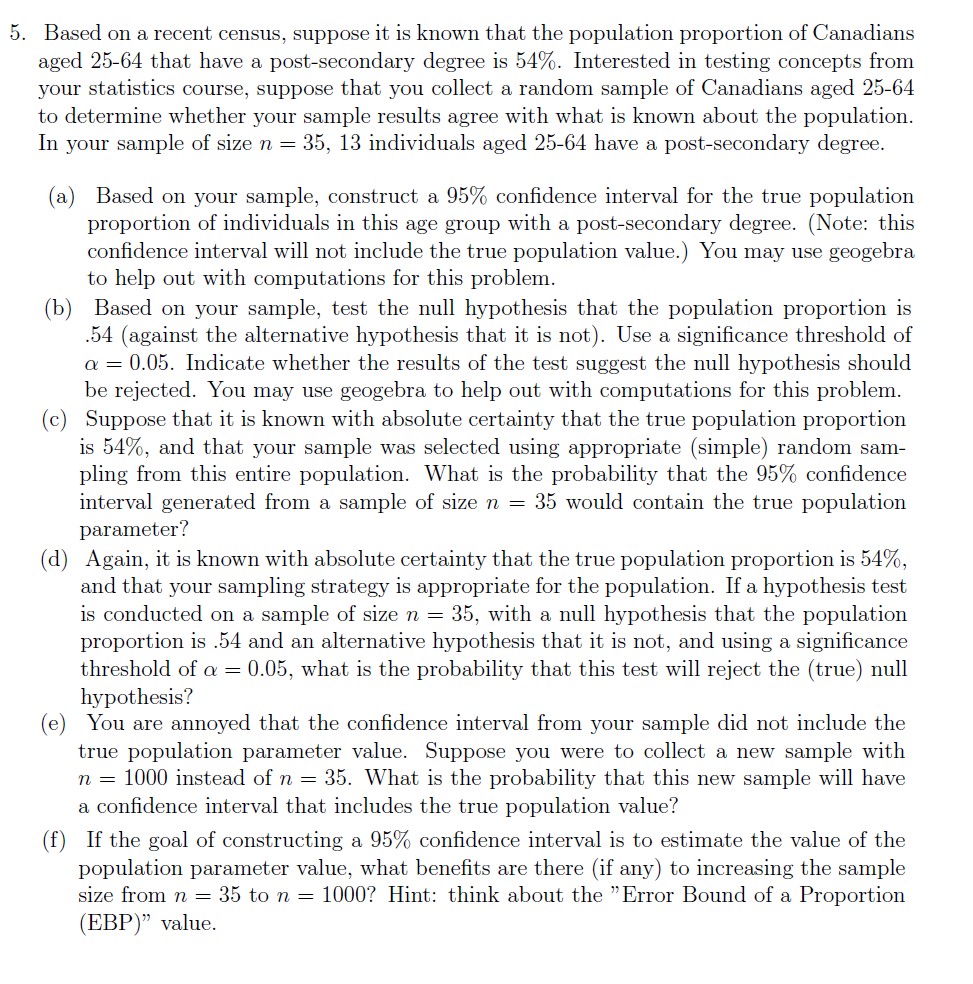
5. Based on a recent census, suppose it is known that the population proportion of Canadians aged 25454 that have a postrsecondary degree is 54%. Interested in testing concepts from your statistics course, suppose that you collect a random sample of Canadians aged 25434 to determine whether your sample results agree with what is known about the population. In your sample of size n = 35, 13 individuals aged 2564 have a postsecondary degree. (a) Based on your sample, construct a 95% condence interval for the true population proportion of individuals in this age group with a postssecondary degree. (Note: this condence interval will not include the true population value.) You may use geogebra to help out with computations for this problem. (b) Based on your sample, test the null hypothesis that the population proportion is (C) (d) (f) .54 (against the alternative hypothesis that it is not). Use a signicance threshold of o: = 0.05. Indicate whether the results of the test suggest the null hypothesis should be rejected. You may use geogebra to help out with computations for this problem. Suppose that it is known with absolute certainty that the true population proportion is 54%, and that your sample was selected using appropriate (simple) random sam pling from this entire population. What is the probability that the 95% condence interval generated from a sample of size n = 35 would contain the true population parameter? Again, it is known with absolute certainty that the true population proportion is 54%, and that your sampling strategy is appropriate for the population. If a hypothesis test is conducted on a sample of size n, = 35, with a null hypothesis that the population proportion is .54 and an alternative hypothesis that it is not, and using a signicance threshold of o: = 0.05, what is the probability that this test will reject the (true) null hypothesis? You are annoyed that the condence interval from your sample did not include the true population parameter value. Suppose you were to collect a new sample with n = 1000 instead of n = 35. What is the probability that this new sample will have a condence interval that includes the true population value? If the goal of constructing a 95% condence interval is to estimate the value of the population parameter value, what benets are there (if any) to increasing the sample size from n = 35 to n = 1000? Hint: think about the "Error Bound of a Proportion (EBP)\" value


