

Question: Please help! Please show me how to complete the rest of the table as well as help me graph all 4 graphs with excel graph!
Please help! Please show me how to complete the rest of the table as well as help me graph all 4 graphs with excel graph! I don't know how to use excel graph, please show me how!
Thank you so much for your time!
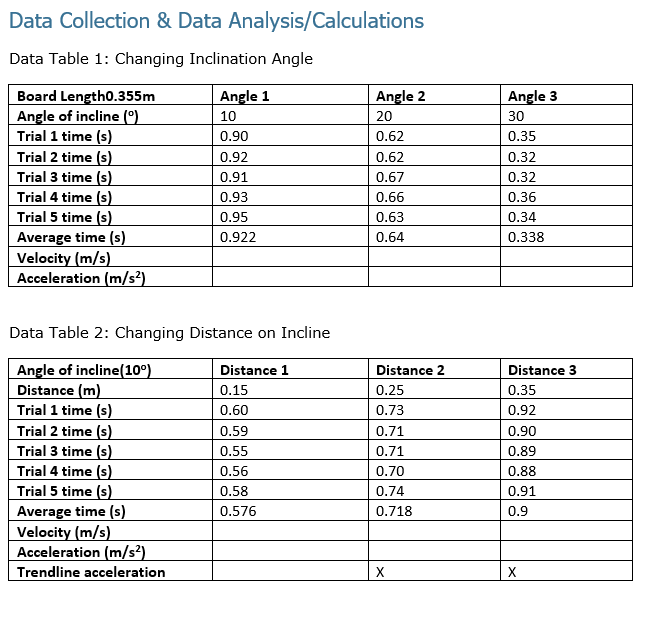
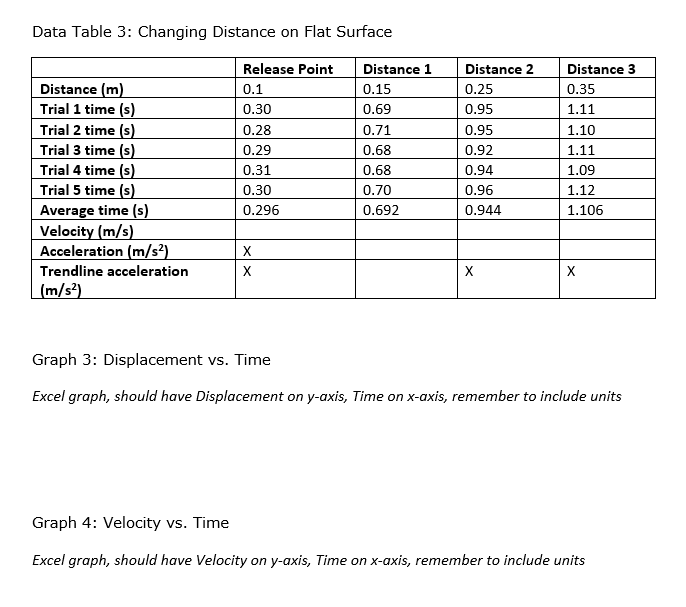
Data Collection & Data Analysis/Calculations Data Table 1: Changing Inclination Angle Board Length0.355m Angle 1 Angle 2 Angle 3 Angle of incline (") 10 20 30 Trial 1 time (s) 0.90 0.62 0.35 Trial 2 time (s) 0.92 0.62 0.32 Trial 3 time (s) 0.91 0.67 0.32 Trial 4 time (s) 0.93 0.66 0.36 Trial 5 time (s) 0.95 0.63 0.34 Average time (s) 0.922 0.64 0.338 Velocity (m/s) Acceleration (m/s?) Data Table 2: Changing Distance on Incline Angle of incline(10") Distance 1 Distance 2 Distance 3 Distance (m) 0.15 0.25 0.35 Trial 1 time (s) 0.60 0.73 0.92 Trial 2 time (s) 0.59 0.71 0.90 Trial 3 time (s) 0.55 0.71 0.89 Trial 4 time (s) 0.56 0.70 0.88 Trial 5 time (s) 0.58 0.74 0.91 Average time (s) 0.576 0.718 0.9 Velocity (m/s) Acceleration (m/s?) Trendline acceleration X XPhoto of Motion Diagram: Graph 1: Distance vs. Time Excel graph, should have Distance on y-axis, Time on x-axis, remember to include units Graph 2: Velocity vs. Time Excel graph, should have Velocity on y-axis, Time on x-axis, remember to include unitsData Table 3: Changing Distance on Flat Surface Release Point Distance 1 Distance 2 Distance 3 Distance (m) 0.1 0.15 0.25 0.35 Trial 1 time (s) 0.30 0.69 0.95 1.11 Trial 2 time (s) 0.28 0.71 0.95 1.10 Trial 3 time (s) 0.29 0.68 0.92 1.11 Trial 4 time (s) 0.31 0.68 0.94 1.09 Trial 5 time (s) 0.30 0.70 0.96 1.12 Average time (s) 0.296 0.692 0.944 1.106 Velocity (m/s) Acceleration (m/s?) X Trendline acceleration X X X (m/s2) Graph 3: Displacement vs. Time Excel graph, should have Displacement on y-axis, Time on x-axis, remember to include units Graph 4: Velocity vs. Time Excel graph, should have Velocity on y-axis, Time on x-axis, remember to include units
Step by Step Solution
There are 3 Steps involved in it

Get step-by-step solutions from verified subject matter experts