 Please Help Please
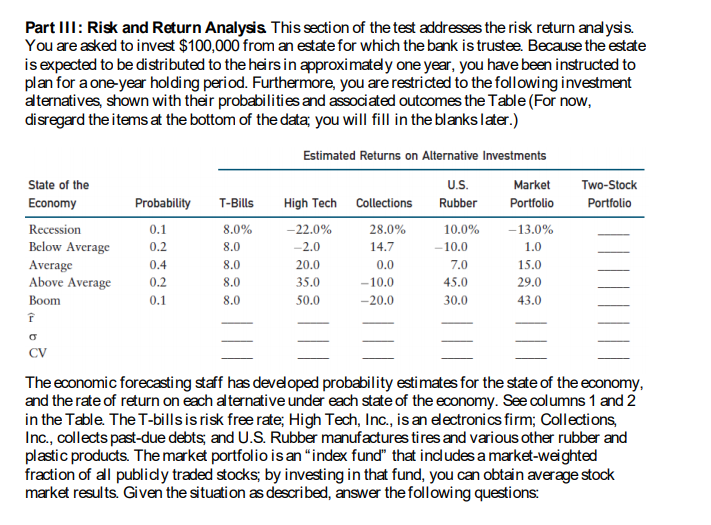
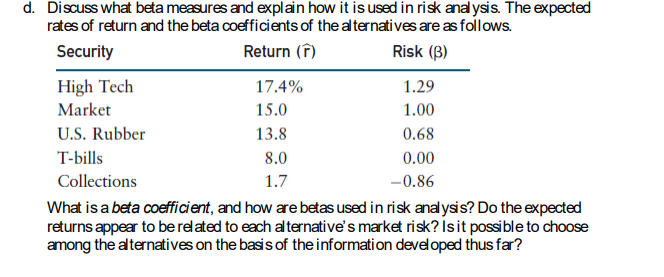
Part III: Risk and Return Analysis. This section of the test addresses the risk return analysis. You are asked to invest $100,000 from an estate for which the bank is trustee. Because the estate is expected to be distributed to the heirs in approximately one year, you have been instructed to plan for a one-year holding period. Furthermore, you are restricted to the following investment alternatives, shown with their probabilities and associated outcomes the Table (For now, disregard the items at the bottom of the data; you will fill in the blanks later.) Two-Stock Portfolio Probability T-Bills State of the Economy Recession Below Average Average Above Average Boom f 0.1 0.2 0.4 0.2 0.1 8.0% 8.0 8.0 8.0 8.0 Estimated Returns on Alternative Investments U.S. Market High Tech Collections Rubber Portfolio - 22.0% 28.0% 10.0% -13.0% -2.0 14.7 -10.0 1.0 20.0 0.0 7.0 15.0 35.0 -10.0 45.0 29.0 50.0 -20.0 30.0 43.0 CV The economic forecasting staff has developed probability estimates for the state of the economy, and the rate of return on each alternative under each state of the economy. See columns 1 and 2 in the Table. The T-bills is risk free rate; High Tech, Inc., is an electronics firm; Collections, Inc., collects past-due debts, and U.S. Rubber manufactures tires and various other rubber and plastic products. The market portfolio is an "index fund" that includes a market-weighted fraction of all publicly traded stocks; by investing in that fund, you can obtain average stock market results. Given the situation as described, answer the following questions: d. Discuss what beta measures and explain how it is used in risk analysis. The expected rates of return and the beta coefficients of the alternatives are as follows. Security Return () Risk (B) High Tech 17.4% 1.29 Market 15.0 1.00 U.S. Rubber 13.8 0.68 T-bills 8.0 0.00 Collections 1.7 -0.86 What is a beta coefficient, and how are betas used in risk analysis? Do the expected returns appear to be related to each alternative's market risk? Isit possible to choose among the alternatives on the basis of the information developed thus far? Part III: Risk and Return Analysis. This section of the test addresses the risk return analysis. You are asked to invest $100,000 from an estate for which the bank is trustee. Because the estate is expected to be distributed to the heirs in approximately one year, you have been instructed to plan for a one-year holding period. Furthermore, you are restricted to the following investment alternatives, shown with their probabilities and associated outcomes the Table (For now, disregard the items at the bottom of the data; you will fill in the blanks later.) Two-Stock Portfolio Probability T-Bills State of the Economy Recession Below Average Average Above Average Boom f 0.1 0.2 0.4 0.2 0.1 8.0% 8.0 8.0 8.0 8.0 Estimated Returns on Alternative Investments U.S. Market High Tech Collections Rubber Portfolio - 22.0% 28.0% 10.0% -13.0% -2.0 14.7 -10.0 1.0 20.0 0.0 7.0 15.0 35.0 -10.0 45.0 29.0 50.0 -20.0 30.0 43.0 CV The economic forecasting staff has developed probability estimates for the state of the economy, and the rate of return on each alternative under each state of the economy. See columns 1 and 2 in the Table. The T-bills is risk free rate; High Tech, Inc., is an electronics firm; Collections, Inc., collects past-due debts, and U.S. Rubber manufactures tires and various other rubber and plastic products. The market portfolio is an "index fund" that includes a market-weighted fraction of all publicly traded stocks; by investing in that fund, you can obtain average stock market results. Given the situation as described, answer the following questions: d. Discuss what beta measures and explain how it is used in risk analysis. The expected rates of return and the beta coefficients of the alternatives are as follows. Security Return () Risk (B) High Tech 17.4% 1.29 Market 15.0 1.00 U.S. Rubber 13.8 0.68 T-bills 8.0 0.00 Collections 1.7 -0.86 What is a beta coefficient, and how are betas used in risk analysis? Do the expected returns appear to be related to each alternative's market risk? Isit possible to choose among the alternatives on the basis of the information developed thus far