Please help
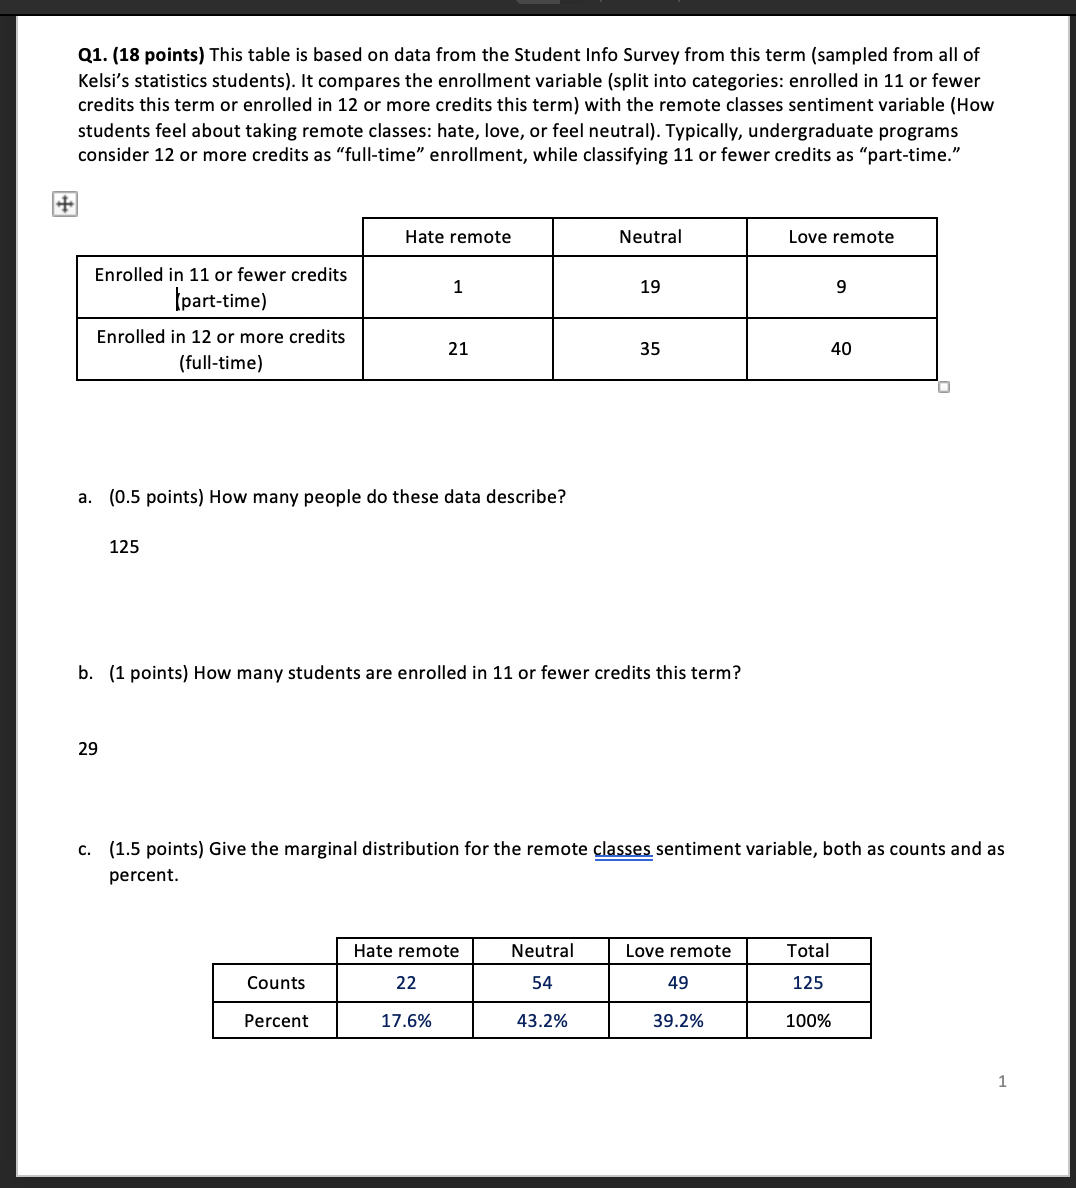
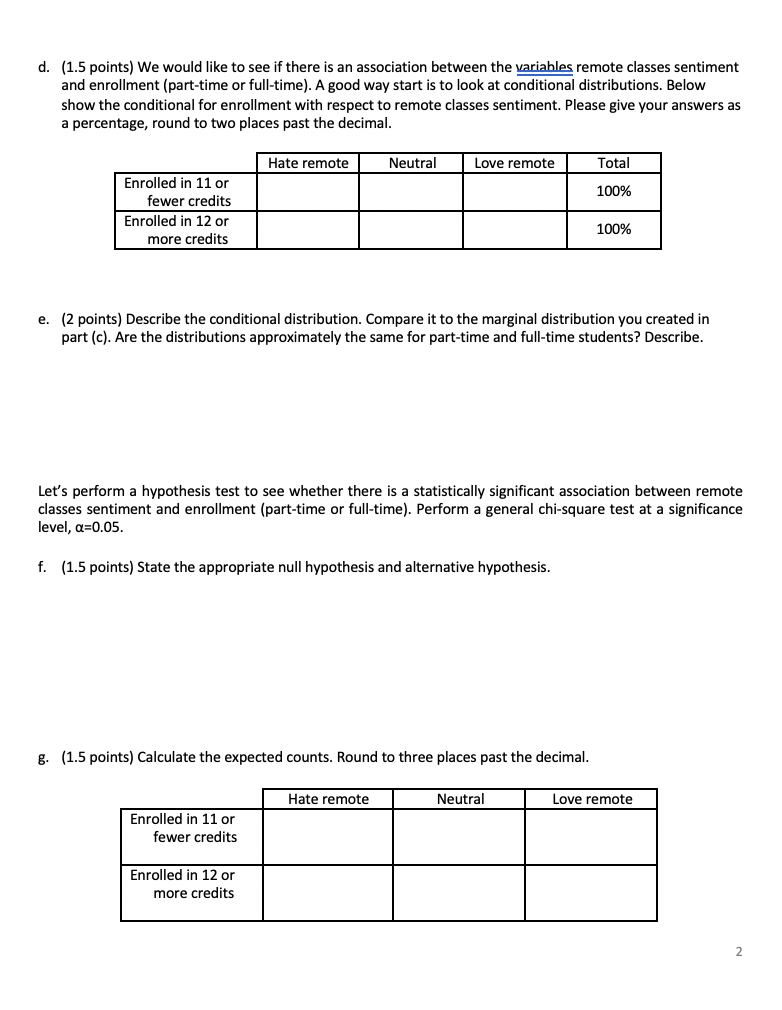
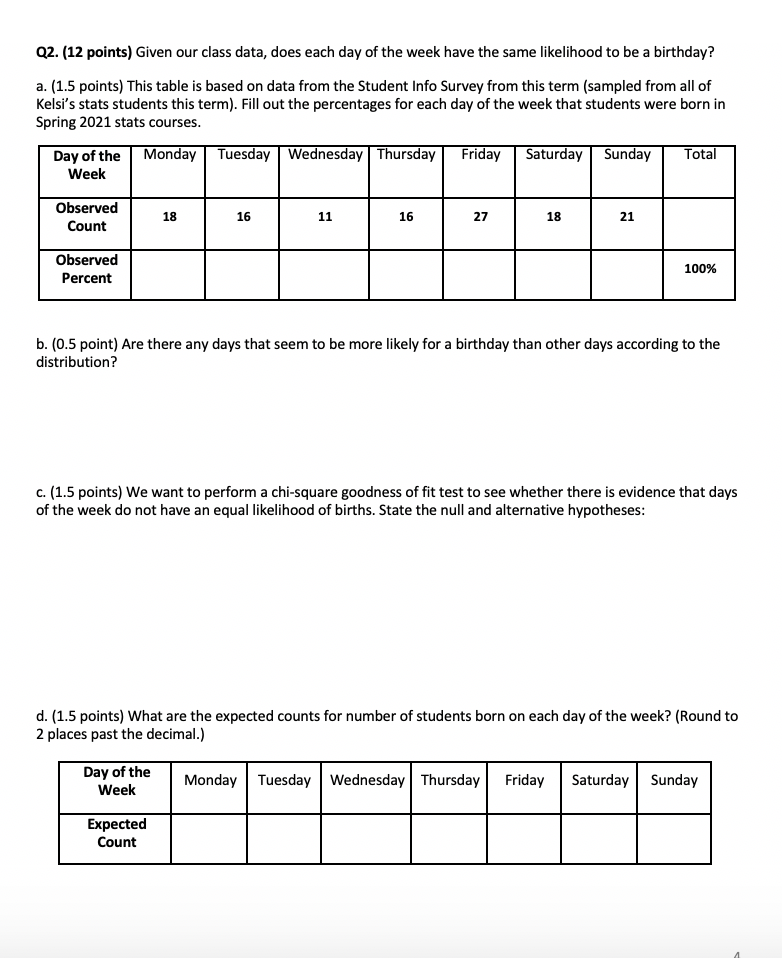
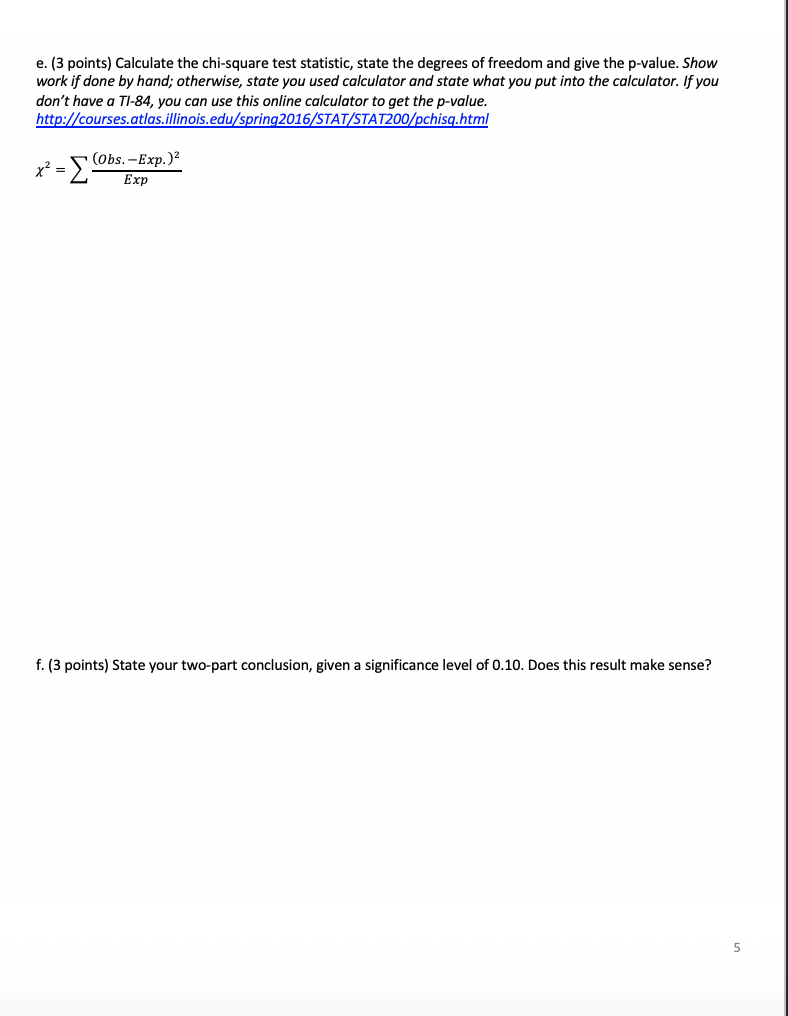
Q1. (18 points) This table is based on data from the Student Info Survey from this term {sampled from all of Kelsi's statistics students}. It compares the enrollment variable {split into categories: enrolled in 11 or fewer credits this term or enrolled in 12 or more credits this term} with the remote classes sentiment variable {How students feel about taking remote classes: hate, love, or feel neutral). Typically, undergraduate programs consider 12 or more credits as \"full-time\" enrollment, while classifying 11 or fewer credits as \"part-time.\" Enrolled in 11 or fewer credits 1 [part-time) Enrolled in 12 or more credits 21 {full-time) a. {0.5 points) How many people do these data describe? 125 b. {1 points} How many students are enrolled in 11 or fewer credits this term? c. {1.5 points} Give the marginal distribution for the remote classessentiment variable, both as counts and as percent. "m Total \"In 17.5% 43.2% 39.2% 100% d. (1.5 points) We would like to see if there is an association between the variables remote classes sentiment and enrollment (part-time or full-time). A good way start is to look at conditional distributions. Below show the conditional for enrollment with respect to remote classes sentiment. Please give your answers as a percentage, round to two places past the decimal. Hate remote Neutral Love remote Total Enrolled in 11 or 100% fewer credits Enrolled in 12 or 100% more credits e. (2 points) Describe the conditional distribution. Compare it to the marginal distribution you created in part (c). Are the distributions approximately the same for part-time and full-time students? Describe. Let's perform a hypothesis test to see whether there is a statistically significant association between remote classes sentiment and enrollment (part-time or full-time). Perform a general chi-square test at a significance level, a=0.05. f. (1.5 points) State the appropriate null hypothesis and alternative hypothesis. g. (1.5 points) Calculate the expected counts. Round to three places past the decimal. Hate remote Neutral Love remote Enrolled in 11 or fewer credits Enrolled in 12 or more credits 2Q2. [12 points} Given our class data, does each dayI of the week have the same likelith to be a birthday? a. [1.5 points) This table is based on data from the Student Info Survey from this term [sampled from all of Kelsi's stats students this term]. Fill out the percentages for each day of the week that students were born in Spring 2021 stats courses. Dayan\" wadndall Thurs\"? ?\" Week Observed Observed Percent b. {0.5 point] Are there any days that seem to be more likely for a birthday than other days according to the distribution ? c. [1.5 points) We want to perform a chi-squa re goodness of fittest to see whether there is evidence that days of the week do not have an equal likelihood of births. State the null and alternative hypotheses: d. {1.5 points] What are the expected counts for number of students born on each day of the week? [Round to 2 places pastthe decimal.) Da'vugfeihe wadnday Thumdav Expected Count e. (3 points) Calculate the chi-square test statistic, state the degrees of freedom and give the p-value. Show work if done by hand; otherwise, state you used calculator and state what you put into the calculator. If you don't have a TI-84, you can use this online calculator to get the p-value. http://courses.atlas.illinois.edu/spring2016/STAT/STAT200/pchisq.html x2 = (Obs. -Exp. )2 Exp f. (3 points) State your two-part conclusion, given a significance level of 0.10. Does this result make sense? 5g. (1 points) Specifically, why might we be concerned with using this data to make inference to a larger population
