Answered step by step
Verified Expert Solution
Link Copied!

Question

1 Approved Answer

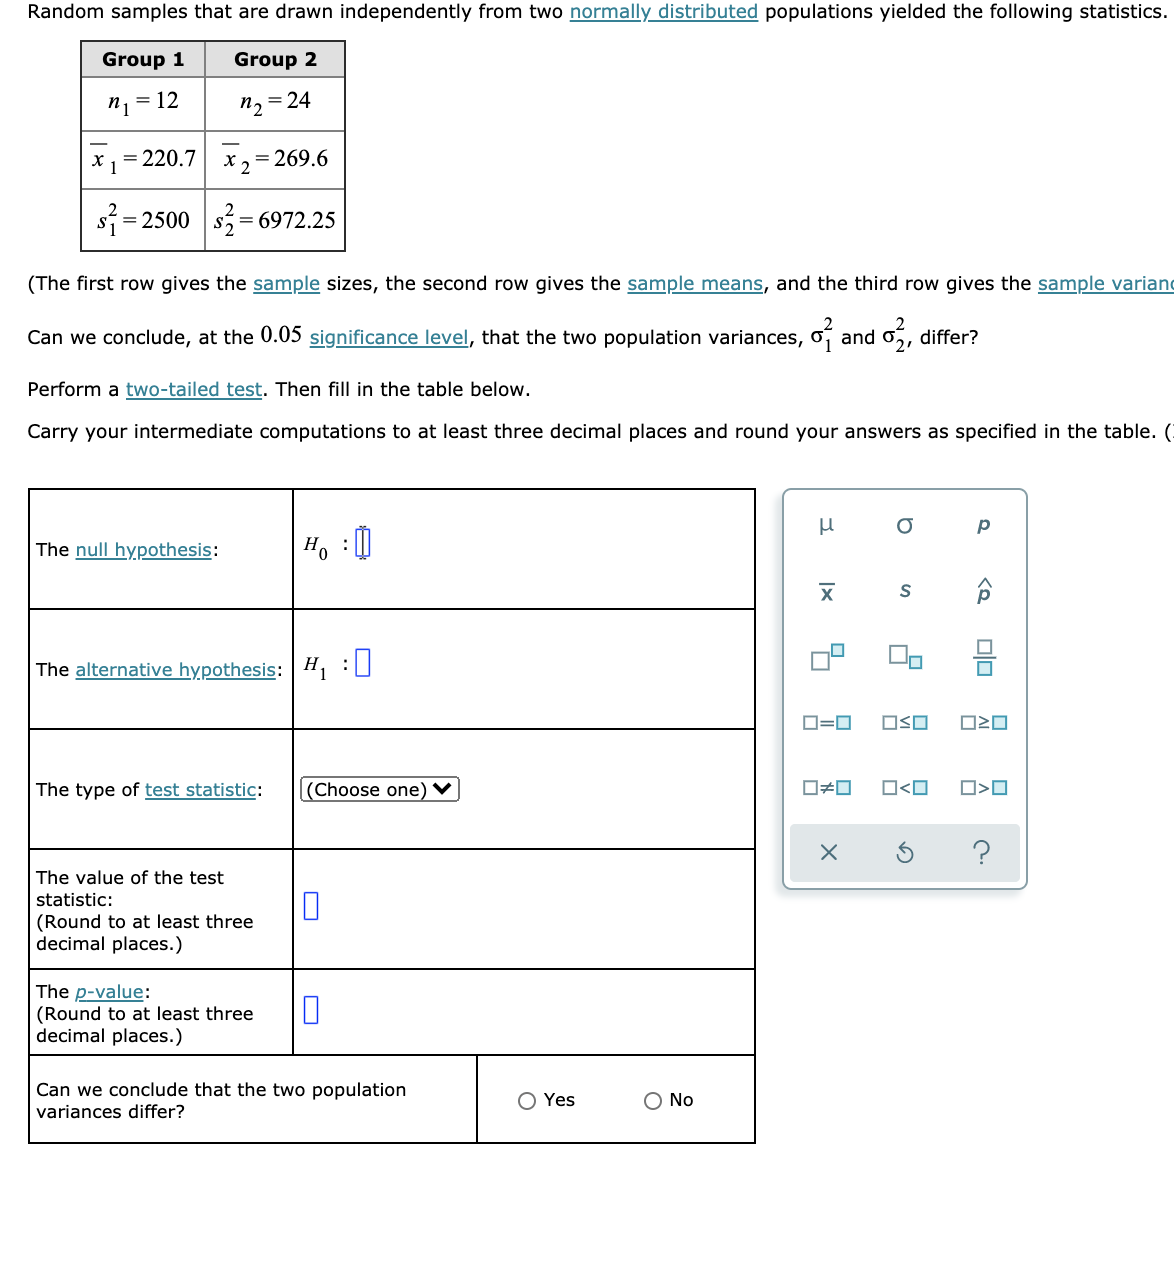
please help Random samples that are drawn independently from two normally distributed populations yielded the following statistics. Group 1 Group 2 n = 12 n,

please help

image text in transcribed
Random samples that are drawn independently from two normally distributed populations yielded the following statistics. Group 1 Group 2 n = 12 n, = 24 x =220.7 x 2 =269.6 S7 = 2500 S2 = 6972.25 (The first row gives the sample sizes, the second row gives the sample means, and the third row gives the sample varian Can we conclude, at the 0.05 significance level, that the two population variances, of and 2, differ? Perform a two-tailed test. Then fill in the table below. Carry your intermediate computations to at least three decimal places and round your answers as specified in the table. ( P The null hypothesis: Ho : !I X S P The alternative hypothesis: H :0 0=0 OSO 020 The type of test statistic: (Choose one) v] *0 00 X 5 ? The value of the test statistic: (Round to at least three 0 decimal places. The p-value: (Round to at least three 0 decimal places.) Can we conclude that the two population variances differ? O Yes O No

Step by Step Solution

There are 3 Steps involved in it

Step: 1

blur-text-image

Get Instant Access to Expert-Tailored Solutions

See step-by-step solutions with expert insights and AI powered tools for academic success

Step: 2

blur-text-image

Step: 3

blur-text-image

Ace Your Homework with AI

Get the answers you need in no time with our AI-driven, step-by-step assistance

Get Started

Recommended Textbook for

A First Course in Differential Equations with Modeling Applications

Authors: Dennis G. Zill

10th edition

978-1111827052

More Books

Students also viewed these Mathematics questions

Question

10.8

Answered: 1 week ago