
 Please help!!
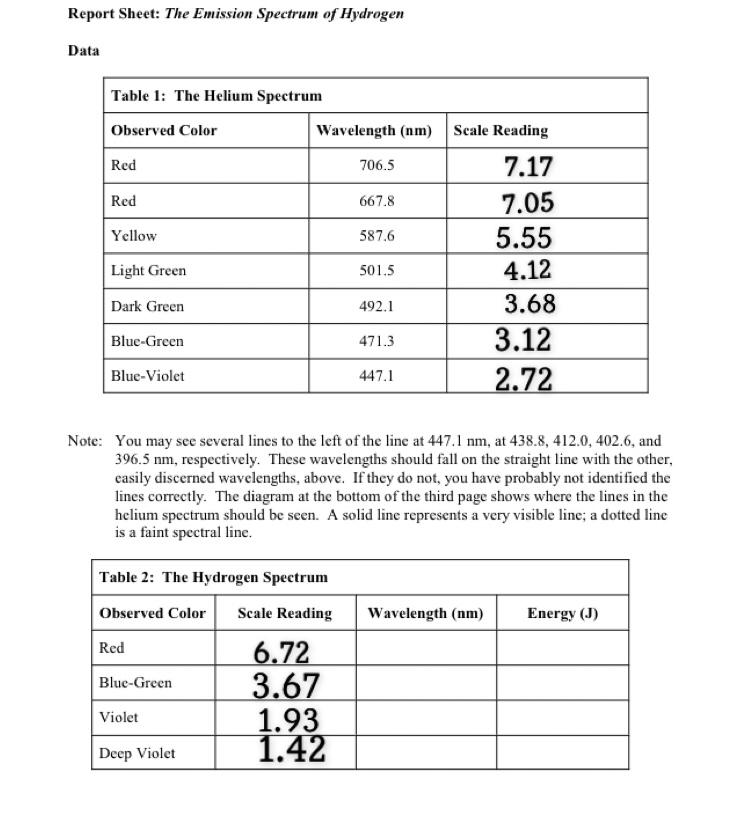
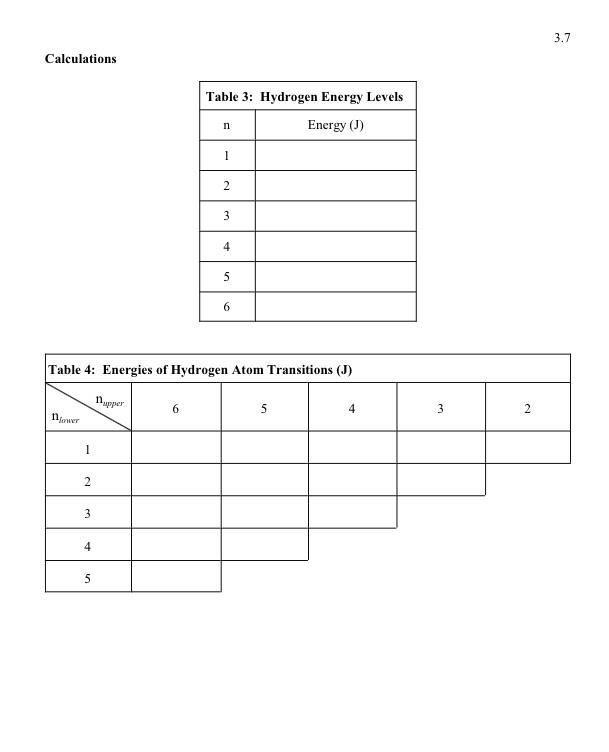
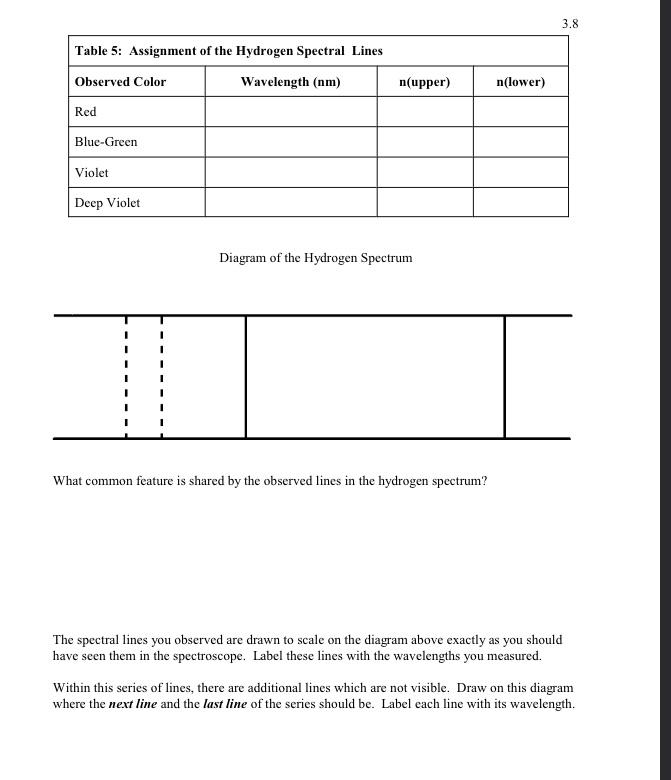
Report Sheet: The Emission Spectrum of Hydrogen Data Note: You may see several lines to the left of the line at 447.1nm, at 438.8,412.0,402.6, and 396.5nm, respectively. These wavelengths should fall on the straight line with the other, easily discerned wavelengths, above. If they do not, you have probably not identified the lines correctly. The diagram at the bottom of the third page shows where the lines in the helium spectrum should be seen. A solid line represents a very visible line; a dotted line is a faint spectral line. Calculations Diagram of the Hydrogen Spectrum What common feature is shared by the observed lines in the hydrogen spectrum? The spectral lines you observed are drawn to scale on the diagram above exactly as you should have seen them in the spectroscope. Label these lines with the wavelengths you measured. Within this series of lines, there are additional lines which are not visible. Draw on this diagram where the next line and the last line of the series should be. Label each line with its wavelength. Report Sheet: The Emission Spectrum of Hydrogen Data Note: You may see several lines to the left of the line at 447.1nm, at 438.8,412.0,402.6, and 396.5nm, respectively. These wavelengths should fall on the straight line with the other, easily discerned wavelengths, above. If they do not, you have probably not identified the lines correctly. The diagram at the bottom of the third page shows where the lines in the helium spectrum should be seen. A solid line represents a very visible line; a dotted line is a faint spectral line. Calculations Diagram of the Hydrogen Spectrum What common feature is shared by the observed lines in the hydrogen spectrum? The spectral lines you observed are drawn to scale on the diagram above exactly as you should have seen them in the spectroscope. Label these lines with the wavelengths you measured. Within this series of lines, there are additional lines which are not visible. Draw on this diagram where the next line and the last line of the series should be. Label each line with its wavelength


 Please help!!


