

Answered step by step
Verified Expert Solution
Question
1 Approved Answer
Please help resolve the ratio analysis. INCOME STATEMENT FOR THE YEAR ENDED DECEMBER 31, 2018 CANADIAN DOLLARS (millions of dollars) Revenue Sales Revenue * Rent
Please help resolve the ratio analysis.
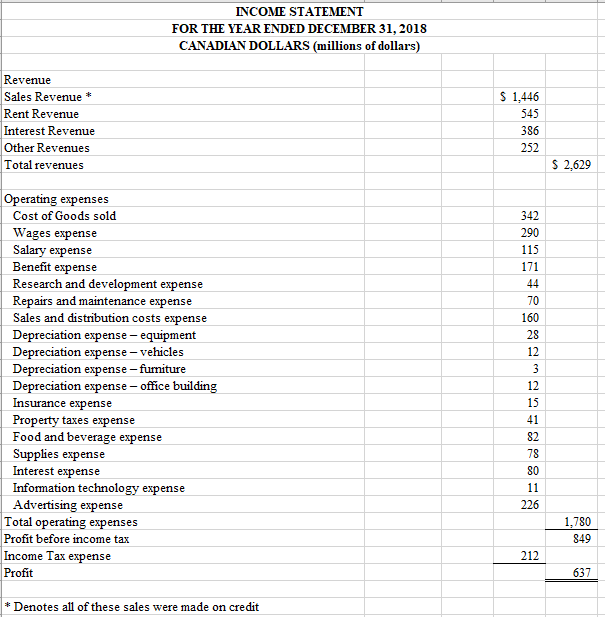
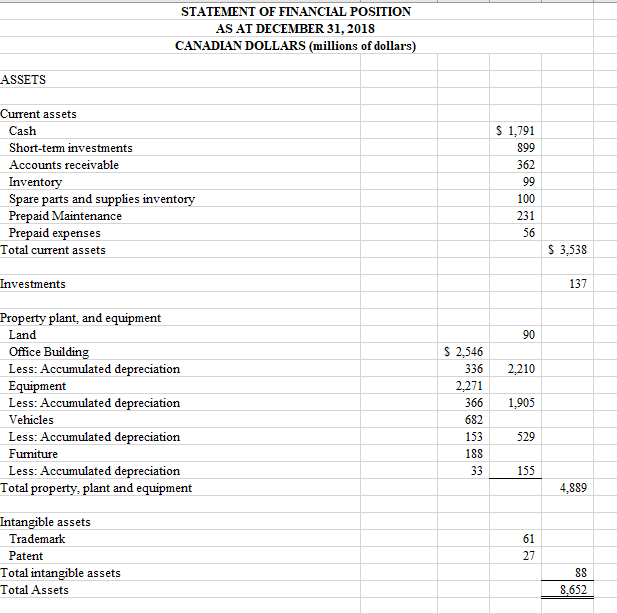
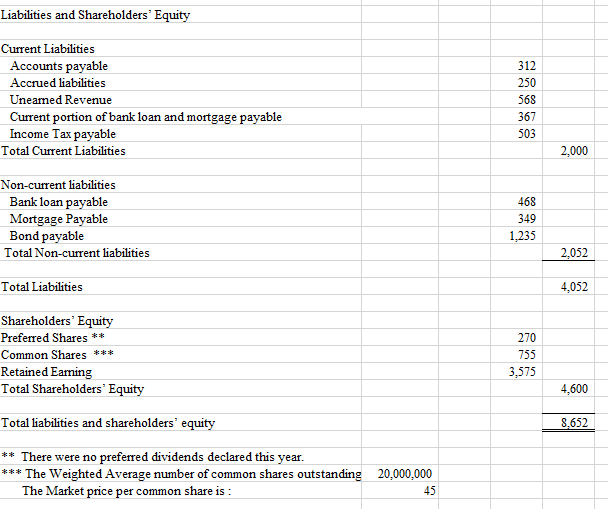
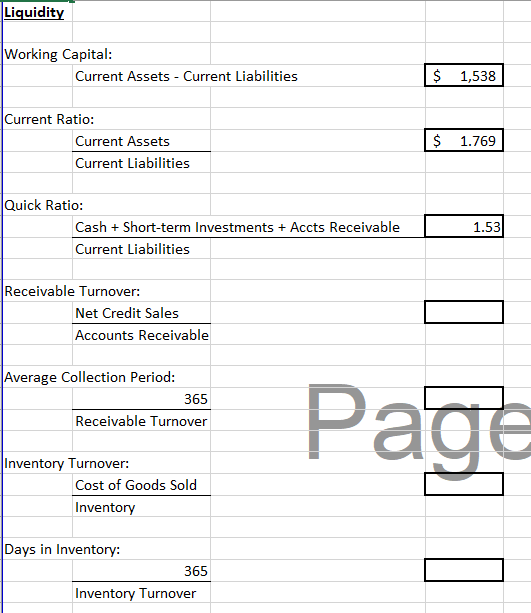
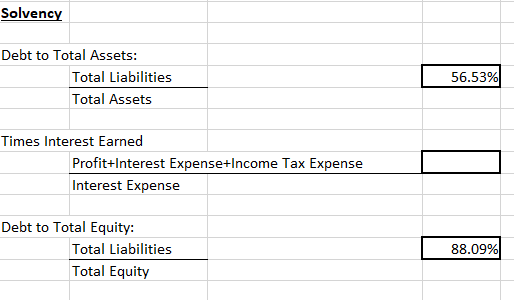
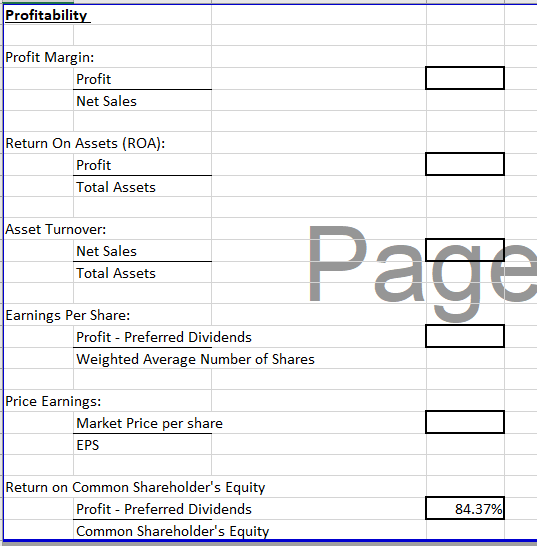
INCOME STATEMENT FOR THE YEAR ENDED DECEMBER 31, 2018 CANADIAN DOLLARS (millions of dollars) Revenue Sales Revenue * Rent Revenue Interest Revenue Other Revenues Total revenues $ 1,446 545 386 252 $ 2,629 342 290 115 70 160 Operating expenses Cost of Goods sold Wages expense Salary expense Benefit expense Research and development expense Repairs and maintenance expense Sales and distribution costs expense Depreciation expense -equipment Depreciation expense-vehicles Depreciation expense - furniture Depreciation expense - office building Insurance expense Property taxes expense Food and beverage expense Supplies expense Interest expense Information technology expense Advertising expense Total operating expenses Profit before income tax Income Tax expense Profit 226 1.780 849 212 637 * Denotes all of these sales were made on credit Liabilities and Shareholders' Equity Current Liabilities Accounts payable Accrued liabilities Uneamed Revenue Current portion of bank loan and mortgage payable Income Tax payable Total Current Liabilities 312 250 568 367 503 2,000 Non-current liabilities Bank loan payable Mortgage Payable Bond payable Total Non-current liabilities 468 349 1,235 2,052 Total Liabilities 4,052 Shareholders' Equity Preferred Shares ** Common Shares *** Retained Earning Total Shareholders' Equity 270 755 3,575 4,600 Total liabilities and shareholders' equity 8.652 ** There were no preferred dividends declared this year. *** The Weighted Average number of common shares outstanding The Market price per common share is : 20,000,000 45 Liquidity Working Capital: Current Assets - Current Liabilities $ 1,538 Current Ratio: Current Assets Current Liabilities $ 1.769 Quick Ratio: Cash + Short-term Investments + Accts Receivable Current Liabilities 1.53 Receivable Turnover: Net Credit Sales Accounts Receivable Average Collection Period: 365 Receivable Turnover Page Inventory Turnover: Cost of Goods Sold Inventory Days in Inventory: 365 Inventory Turnover Solvency Debt to Total Assets: Total Liabilities Total Assets 56.53% Times Interest Earned Profit+Interest Expense+Income Tax Expense Interest Expense Debt to Total Equity: Total Liabilities Total Equity 809 88.09% Profitability Profit Margin: Profit Net Sales Return On Assets (ROA): Profit Total Assets Asset Turnover: Net Sales Total Assets Page Earnings Per Share: Profit - Preferred Dividends Weighted Average Number of Shares Price Earnings: Market Price per share EPS Return on Common Shareholder's Equity Profit - Preferred Dividends Common Shareholder's Equity 84.37%
Step by Step Solution
There are 3 Steps involved in it
Step: 1

Get Instant Access to Expert-Tailored Solutions
See step-by-step solutions with expert insights and AI powered tools for academic success
Step: 2

Step: 3
Ace Your Homework with AI
Get the answers you need in no time with our AI-driven, step-by-step assistance
Get Started
Management And Cost Accounting
Authors: Charles T. Horngren (Author), Alnoor Bhimani (Author), Srikant M. Datar (Author), George Foster
2nd Edition
0273651838, 978-0273651833