

Answered step by step
Verified Expert Solution
Question
1 Approved Answer
Please help Score: 0 of 2 pts 1 of 4 (3 complete) A HW Score: 60.42%, 3.63 of 6 pts 5.1.1 Question Help V The
Please help
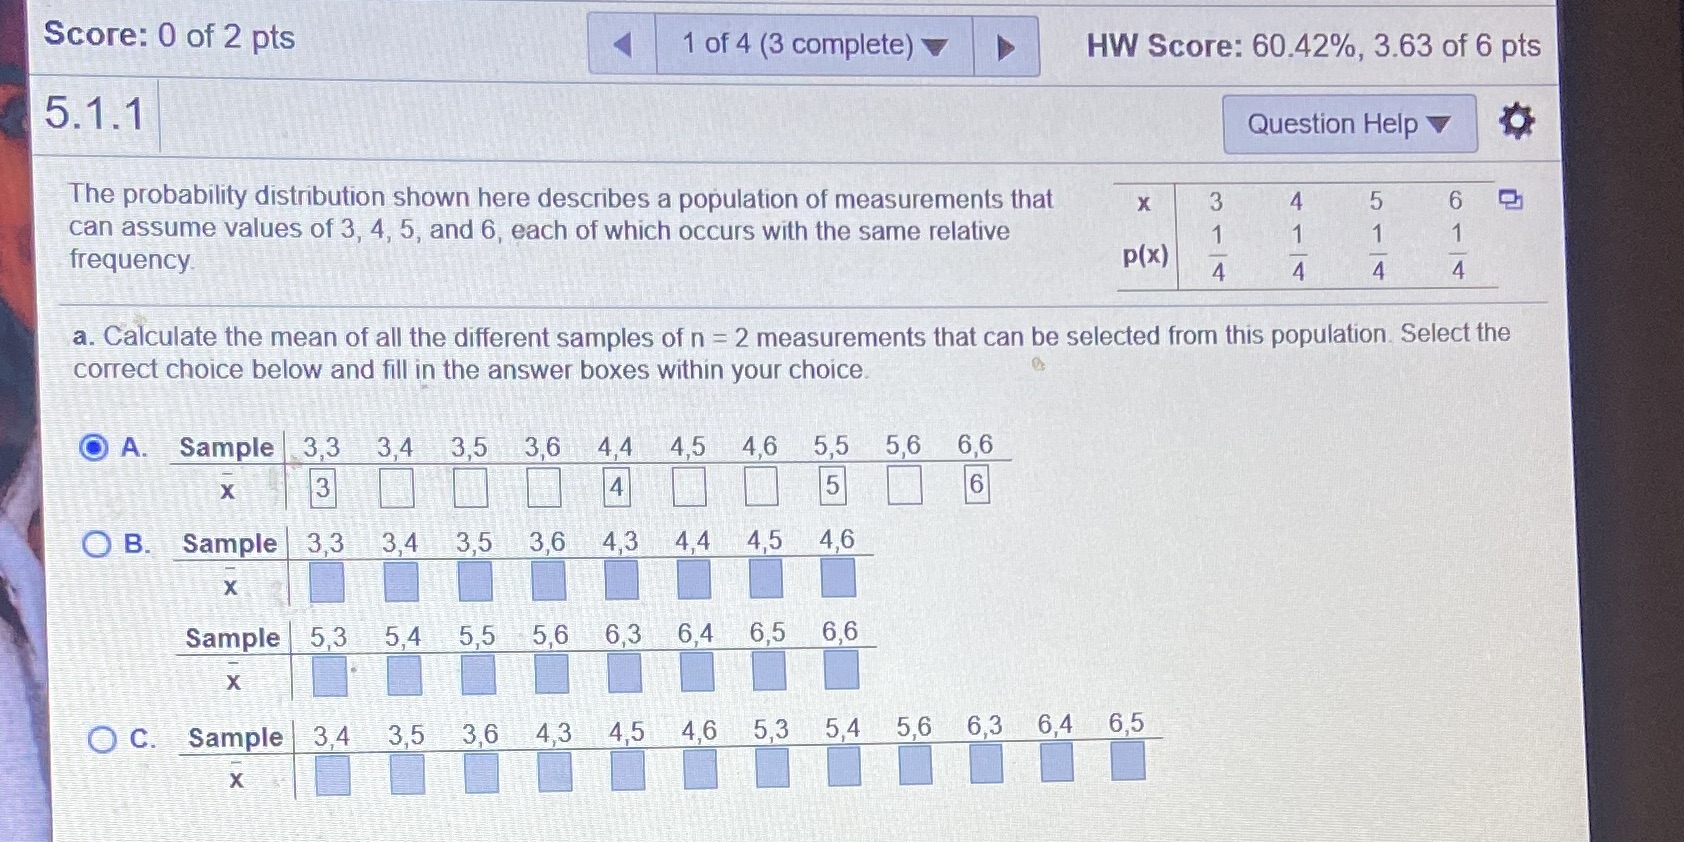 Score: 0 of 2 pts 1 of 4 (3 complete) A HW Score: 60.42%, 3.63 of 6 pts 5.1.1 Question Help V The probability distribution shown here describes a population of measurements that X 3 6 can assume values of 3, 4, 5, and 6, each of which occurs with the same relative frequency p(x) 4 4 A a. Calculate the mean of all the different samples of n = 2 measurements that can be selected from this population. Select the correct choice below and fill in the answer boxes within your choice O A. Sample 3,3 3,4 3,5 3,6 4,4 4,5 46 5,5 5,6 6,6 X 3 4 5 6 O B. Sample 3,3 3,4 3,5 3,6 43 4,4 4,5 4,6 X Sample 5,3 5,4 5,5 5,6 6,3 6,4 6,5 6,6 X O C. Sample 3,4 3,5 3,6 4,3 45 4,6 5,3 54 5,6 6,3 6,4 6,5 X
 Step by Step Solution
There are 3 Steps involved in it
Step: 1

Get Instant Access to Expert-Tailored Solutions
See step-by-step solutions with expert insights and AI powered tools for academic success
Step: 2

Step: 3
Ace Your Homework with AI
Get the answers you need in no time with our AI-driven, step-by-step assistance
Get Started
Precalculus, Enhanced
Authors: Cynthia Y Young
3rd Edition
1119339510, 9781119339519