

Question
Please help! SOS This worksheet contains a table of yields for corn, sorghum, and wheat in New Mexico for the years 2009 through 2018. There
Please help! SOS
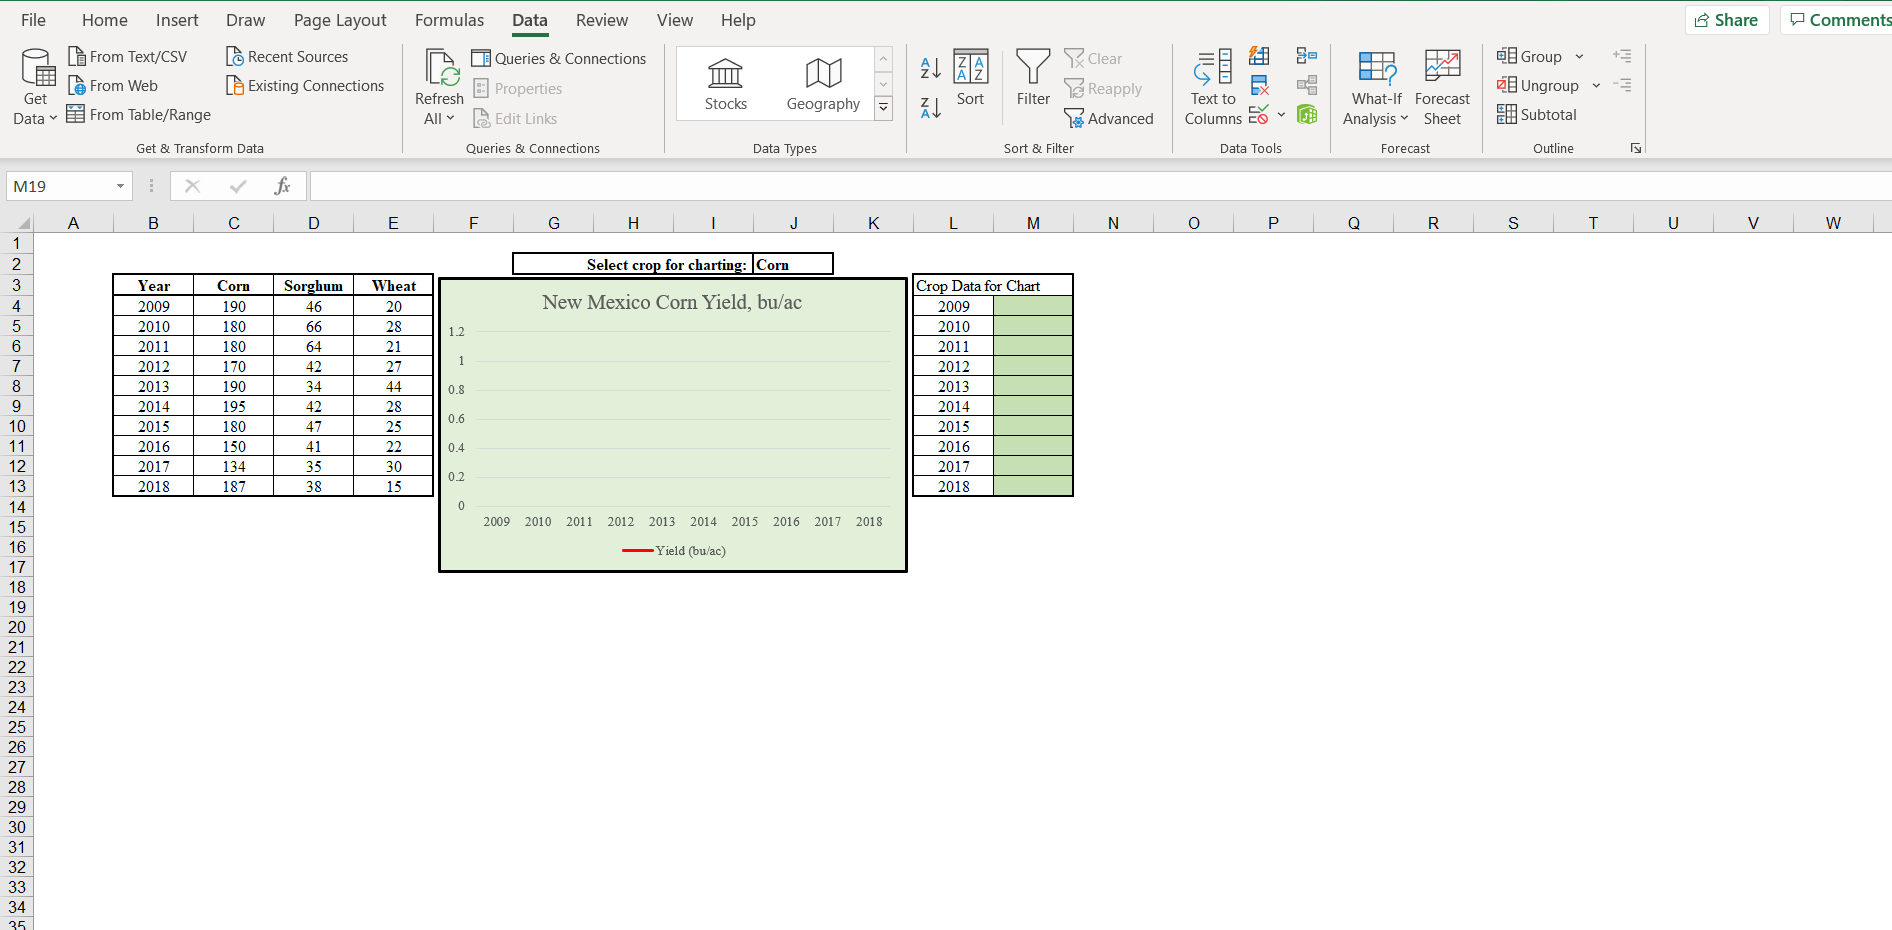
This worksheet contains a table of yields for corn, sorghum, and wheat in New Mexico for the years 2009 through 2018. There is a drop-down list in cell J2 that allows the user to select one of these three crops. The chart should display the yield data for whichever crop has been selected. However, the charts data comes from cells M4:M13. Thus, these cells should contain the crop yields for the selected crop associated with the years in cells L4:L13. For example, if corn has been selected, cell M4 should equal 190. If sorghum has been selected, cell M4 should equal 46. Enter formulas into M4:M13 to return the correct data based on the selected crop.
Step by Step Solution
There are 3 Steps involved in it
Step: 1

Get Instant Access to Expert-Tailored Solutions
See step-by-step solutions with expert insights and AI powered tools for academic success
Step: 2

Step: 3
Ace Your Homework with AI
Get the answers you need in no time with our AI-driven, step-by-step assistance
Get Started
Options Trading For Beginners How To Generate Predictable Income And Make A Living Without Taking Big Risks Even If You Re A Complete Beginner
Authors: Greg Middleton
1st Edition
979-8866955046