Answered step by step
Verified Expert Solution
Question
1 Approved Answer
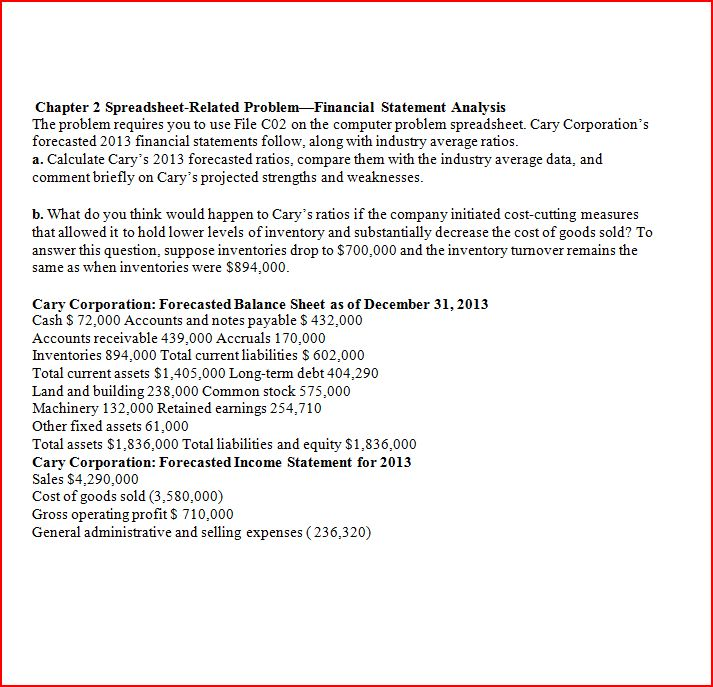
Please Help! Spreadsheet-Related Problem-Financial Statement Analysis The problem requires you to use File C02 on the computer problem spreadsheet. Cary Corporation's forecasted 2013 financial statements


Please Help!
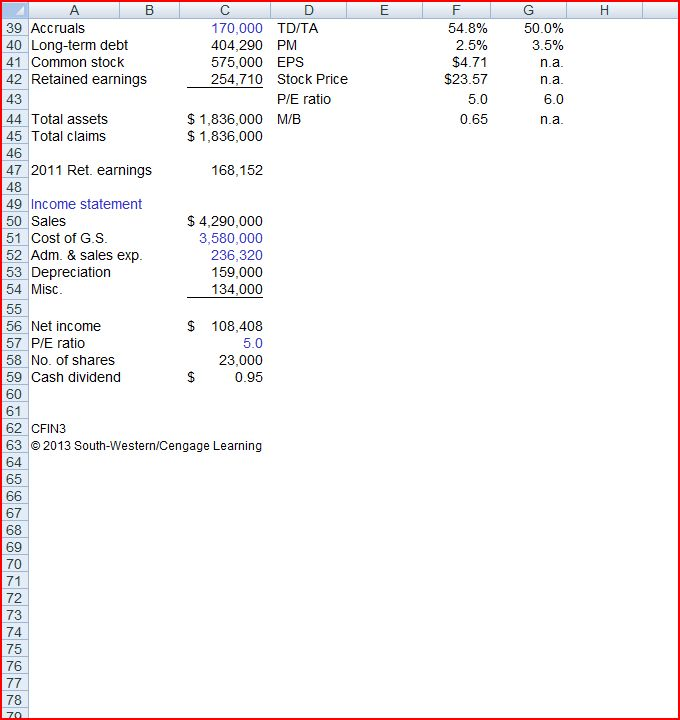
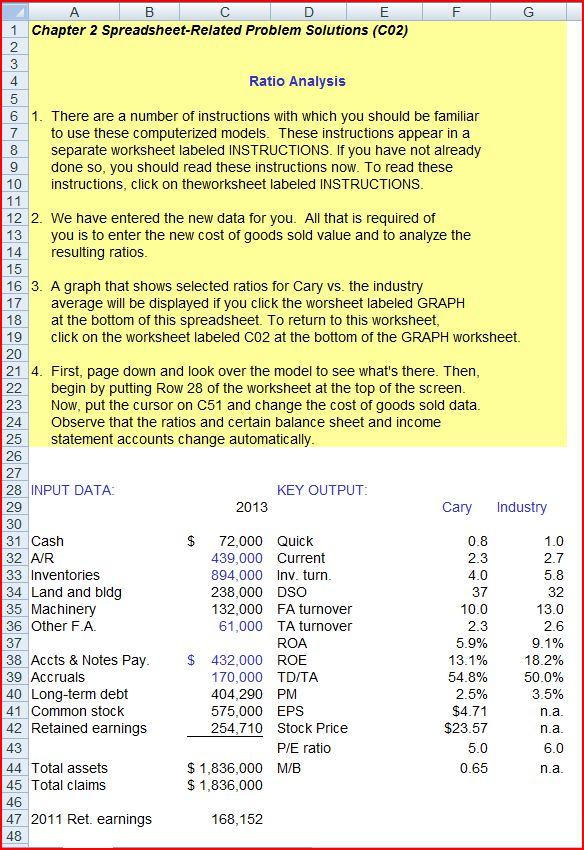
Spreadsheet-Related Problem-Financial Statement Analysis The problem requires you to use File C02 on the computer problem spreadsheet. Cary Corporation's forecasted 2013 financial statements follow, along with industry average ratios. Calculate Cary's 2013 forecasted ratios, compare them with the industry average data, and comment briefly on Cary's projected strengths and weaknesses. What do you think would happen to Cary's ratios if the company initiated cost-cutting measures that allowed it to hold lower levels of inventory and substantially decrease the cost of goods sold? To answer this question, suppose inventories drop to $700,000 and the inventory turnover remains the same as when inventories were $894,000. Cary Corporation: Forecasted Balance Sheet as of December 31,2013 Cash $ 72,000 Accounts and notes payable $ 432,000 Accounts receivable 439,000 Accruals 170,000 Inventories 894,000 Total current liabilities $ 602,000 Total current assets $1,405,000 Long-term debt 404,290 Land and building 238,000 Common stock 575,000 Machinery 132,000 Retained earnings 254,710 Other fixed assets 61,000 Total assets $1,836,000 Total liabilities and equity $1,836,000 Cary Corporation: Forecasted Income Statement for 2013 Sales $4,290,000 Cost of goods sold (3,580,000) Gross operating profit $ 710,000 General administrative and selling expenses (236,320) Nothing to transcribe Only Table Found Spreadsheet-Related Problem Solutions (C02) Ratio Analysis There are a number of instructions with which you should be familiar to use these computerized models. These instructions appear in a separate worksheet labeled INSTRUCTIONS. If you have not already done so, you should read these instructions now. To read these instructions, click on the worksheet labeled INSTRUCTIONS. We have entered the new data for you. All that is required of you is to enter the new cost of goods sold value and to analyze the resulting ratios. A graph that shows selected ratios for Cary vs. the industry average will be displayed if you click the worksheet labeled GRAPH at the bottom of this spreadsheet. To return to this worksheet, click on the worksheet labeled C02 at the bottom of the GRAPH worksheet. First, page down and look over the model to see what's there. Then. begin by putting Row 28 of the worksheet at the top of the screen. Now. put the cursor on C51 and change the cost of goods sold data. Observe that the ratios and certain balance sheet and income statement accounts change automatically. 27 INPUT DATA: KEY OUTPUT: 2013 Cary Industry Spreadsheet-Related Problem-Financial Statement Analysis The problem requires you to use File C02 on the computer problem spreadsheet. Cary Corporation's forecasted 2013 financial statements follow, along with industry average ratios. Calculate Cary's 2013 forecasted ratios, compare them with the industry average data, and comment briefly on Cary's projected strengths and weaknesses. What do you think would happen to Cary's ratios if the company initiated cost-cutting measures that allowed it to hold lower levels of inventory and substantially decrease the cost of goods sold? To answer this question, suppose inventories drop to $700,000 and the inventory turnover remains the same as when inventories were $894,000. Cary Corporation: Forecasted Balance Sheet as of December 31,2013 Cash $ 72,000 Accounts and notes payable $ 432,000 Accounts receivable 439,000 Accruals 170,000 Inventories 894,000 Total current liabilities $ 602,000 Total current assets $1,405,000 Long-term debt 404,290 Land and building 238,000 Common stock 575,000 Machinery 132,000 Retained earnings 254,710 Other fixed assets 61,000 Total assets $1,836,000 Total liabilities and equity $1,836,000 Cary Corporation: Forecasted Income Statement for 2013 Sales $4,290,000 Cost of goods sold (3,580,000) Gross operating profit $ 710,000 General administrative and selling expenses (236,320) Nothing to transcribe Only Table Found Spreadsheet-Related Problem Solutions (C02) Ratio Analysis There are a number of instructions with which you should be familiar to use these computerized models. These instructions appear in a separate worksheet labeled INSTRUCTIONS. If you have not already done so, you should read these instructions now. To read these instructions, click on the worksheet labeled INSTRUCTIONS. We have entered the new data for you. All that is required of you is to enter the new cost of goods sold value and to analyze the resulting ratios. A graph that shows selected ratios for Cary vs. the industry average will be displayed if you click the worksheet labeled GRAPH at the bottom of this spreadsheet. To return to this worksheet, click on the worksheet labeled C02 at the bottom of the GRAPH worksheet. First, page down and look over the model to see what's there. Then. begin by putting Row 28 of the worksheet at the top of the screen. Now. put the cursor on C51 and change the cost of goods sold data. Observe that the ratios and certain balance sheet and income statement accounts change automatically. 27 INPUT DATA: KEY OUTPUT: 2013 Cary IndustryStep by Step Solution
There are 3 Steps involved in it
Step: 1

Get Instant Access to Expert-Tailored Solutions
See step-by-step solutions with expert insights and AI powered tools for academic success
Step: 2

Step: 3

Ace Your Homework with AI
Get the answers you need in no time with our AI-driven, step-by-step assistance
Get Started


