Answered step by step
Verified Expert Solution
Link Copied!

Question

1 Approved Answer

Please help. thank you. Using the combined data set of females and males, generate a X:Y scatter plot of wingspan (y axis) vs. height (x-axis).

Please help. thank you.
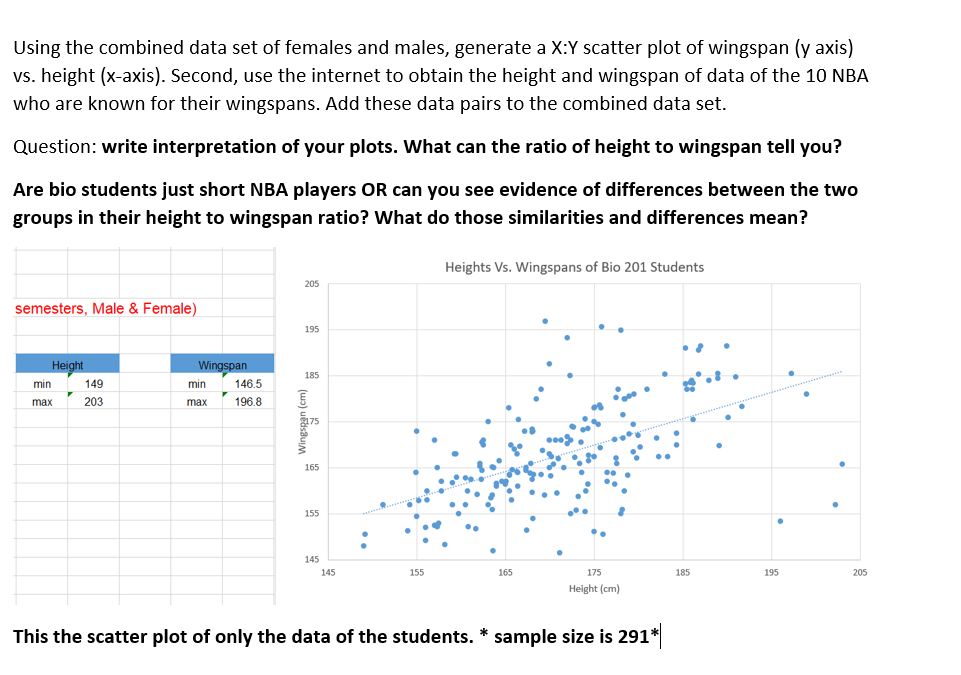
image text in transcribedimage text in transcribedimage text in transcribedimage text in transcribed
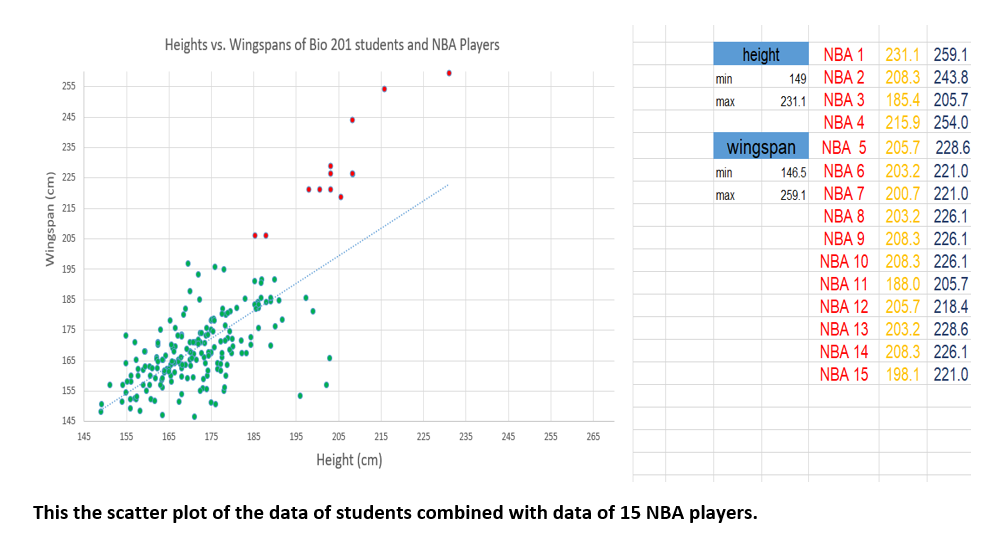
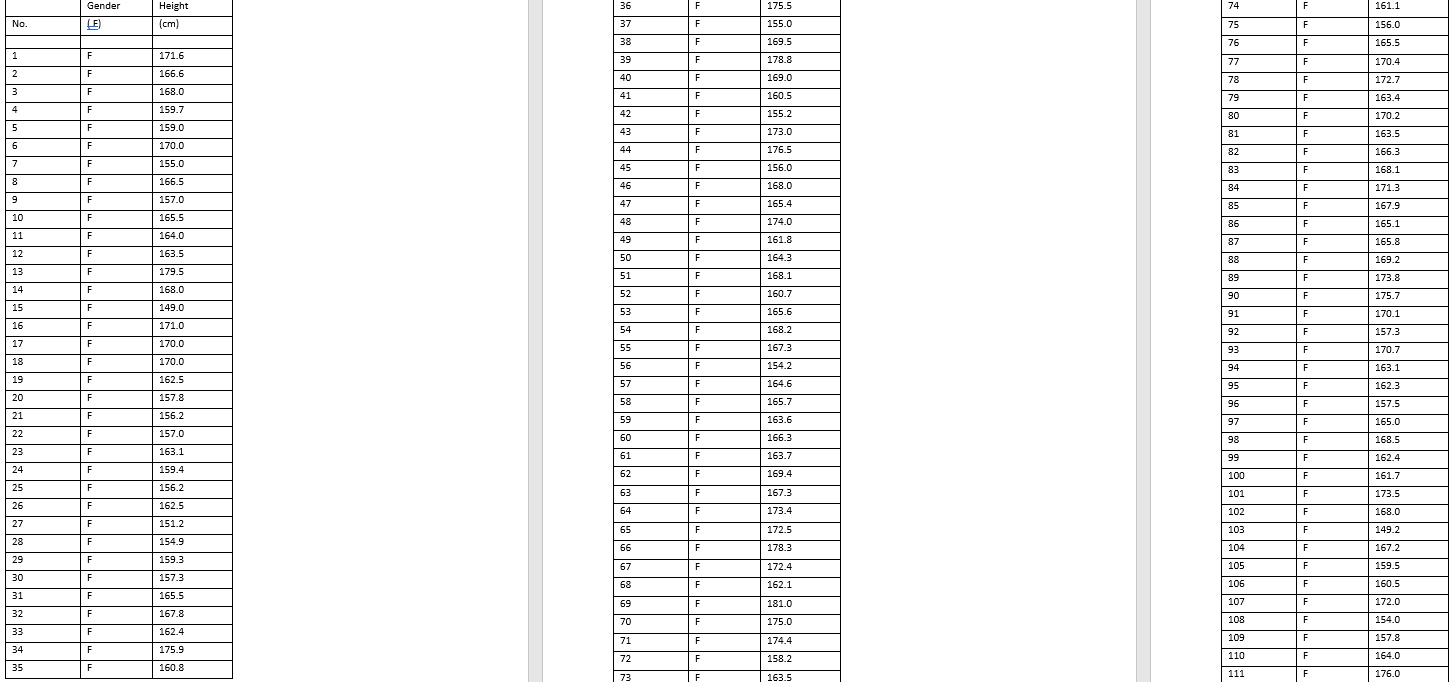
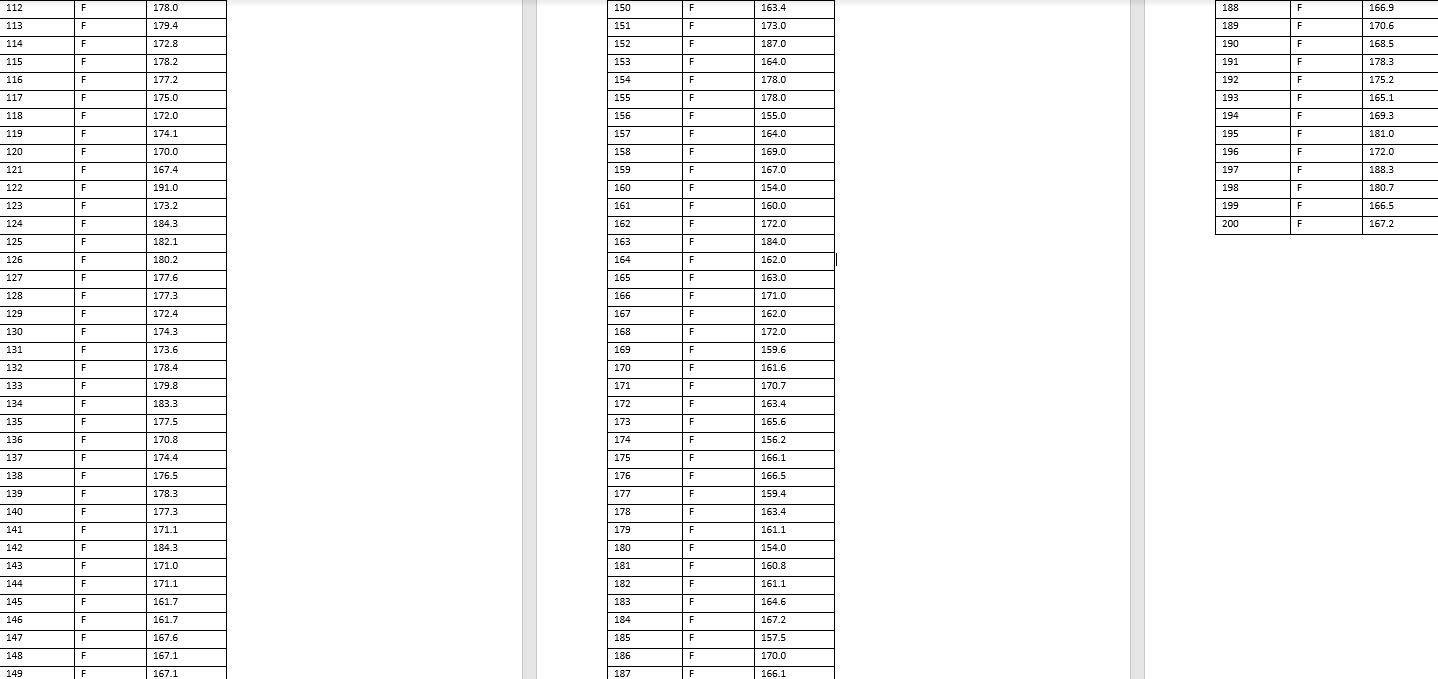
Using the combined data set of females and males, generate a X:Y scatter plot of wingspan (y axis) vs. height (x-axis). Second, use the internet to obtain the height and wingspan of data of the 10 NBA who are known for their wingspans. Add these data pairs to the combined data set. Question: write interpretation of your plots. What can the ratio of height to wingspan tell you? Are bio students just short NBA players OR can you see evidence of differences between the two groups in their height to wingspan ratio? What do those similarities and differences mean? Heights Vs. Wingspans of Bio 201 Students 205 semesters, Male & Female) 195 Height Wingspan min 149 min 146.5 185 max 203 max 196.8 165 155 145 145 155 165 175 185 195 205 Height (cm) This the scatter plot of only the data of the students. * sample size is 291*Heights vs. Wingspans of Bio 201 students and NBA Players height NBA 1 231.1 259.1 255 min 149 NBA 2 208.3 243.8 max 231.1 NBA 3 185.4 205.7 245 NBA 4 215.9 254.0 235 wingspan NBA 5 205.7 228.6 Wingspan (cm) 225 min 146.5 NBA 6 203.2 221.0 .. . 215 max 259.1 NBA 7 200.7 221.0 NBA 8 203.2 226.1 205 NBA 9 208.3 226.1 195 NBA 10 208.3 226.1 185 NBA 11 188.0 205.7 NBA 12 205.7 218.4 175 NBA 13 203.2 228.6 165 NBA 14 208.3 226.1 NBA 15 198.1 221.0 155 145 145 155 165 175 185 195 206 215 225 235 245 255 265 Height (cm) This the scatter plot of the data of students combined with data of 15 NBA players.\f\f

Step by Step Solution

There are 3 Steps involved in it

Step: 1

blur-text-image

Get Instant Access to Expert-Tailored Solutions

See step-by-step solutions with expert insights and AI powered tools for academic success

Step: 2

blur-text-image_2

Step: 3

blur-text-image_3

Ace Your Homework with AI

Get the answers you need in no time with our AI-driven, step-by-step assistance

Get Started

Recommended Textbook for

College Algebra Graphs and Models

Authors: Marvin L. Bittinger, Judith A. Beecher, David J. Ellenbogen, Judith A. Penna

5th edition

321845404, 978-0321791009, 321791002, 978-0321783950, 321783956, 978-0321845405

More Books

Students also viewed these Mathematics questions