Answered step by step
Verified Expert Solution
Link Copied!

Question

1 Approved Answer

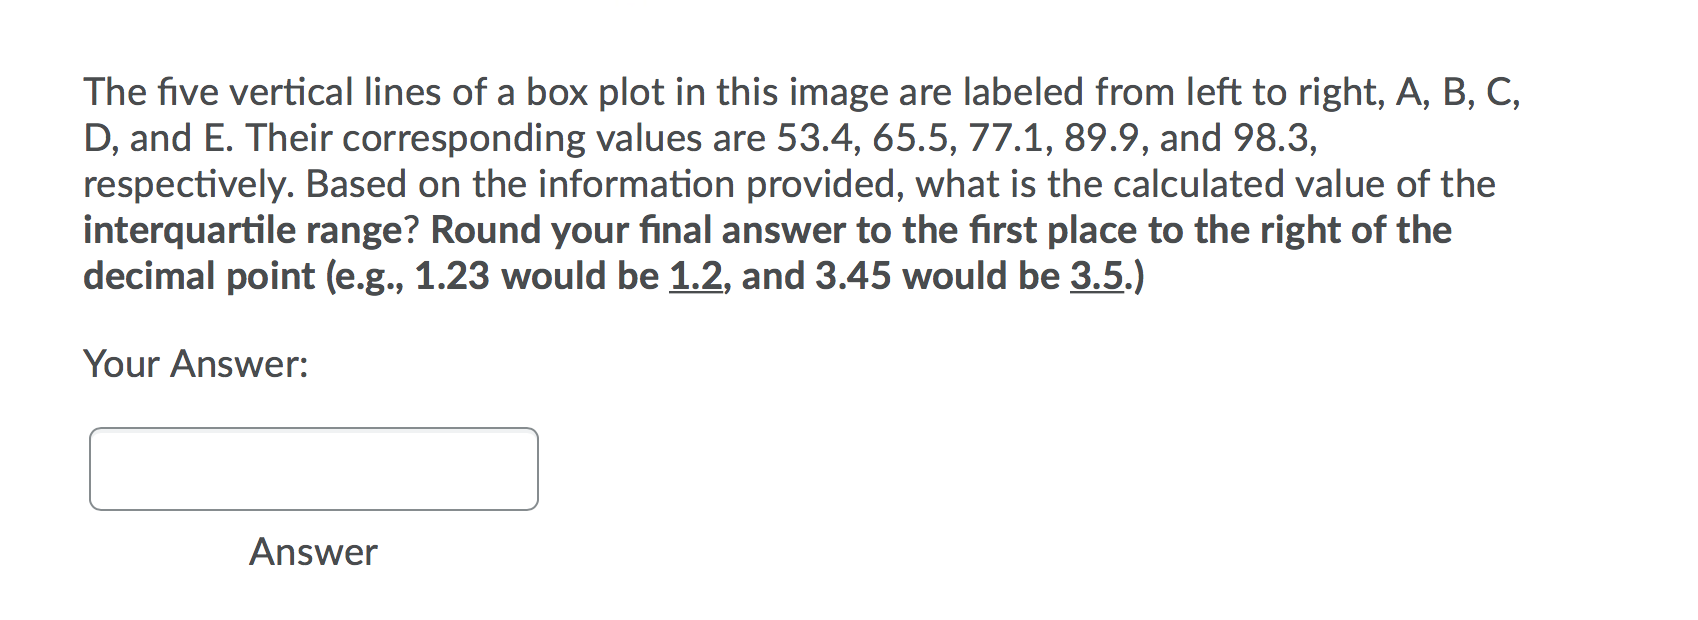
please help The five vertical lines of a box plot in this image are labeled from left to right, A, B, C, D, and E.

please help

image text in transcribedimage text in transcribedimage text in transcribed
The five vertical lines of a box plot in this image are labeled from left to right, A, B, C, D, and E. Their corresponding values are 53.4, 65.5, 77.1, 89.9, and 98.3, respectively. Based on the information provided, what is the calculated value of the interquartile range? Round your final answer to the first place to the right of the decimal point (e.g., 1.23 would be 1.2, and 3.45 would be 3.5.) Your Answer: AnswerThe average life expectancy for male residents of Georgia is 73 years with a population standard deviation of 6 years. What would be the probability of selecting a random sample of 36 men for which the mean age was less than 71 years ? Use decimal form and round your answer to the 4th place to the right of the decimal, The average life expectancy for male residents of Georgia is 73 years with a population standard deviation of 9 years. If a random sample of 36 men was selected with a mean age of 71 years, what would be the value of z for the mean of this sample? Round your z-score value to the 2nd place to the right of the decimal, e.g., 1.23. ~

Step by Step Solution

There are 3 Steps involved in it

Step: 1

blur-text-image

Get Instant Access to Expert-Tailored Solutions

See step-by-step solutions with expert insights and AI powered tools for academic success

Step: 2

blur-text-image

Step: 3

blur-text-image

Ace Your Homework with AI

Get the answers you need in no time with our AI-driven, step-by-step assistance

Get Started

Recommended Textbook for

Applied Calculus

Authors: Stefan Waner, Steven Costenoble

7th Edition

1337514306, 9781337514309

More Books

Students also viewed these Mathematics questions

Question

Evaluate three pros and three cons of e-prescribing

Answered: 1 week ago